
DEM elevation data, all-weather SAR, mineral-fingerprinting hyperspectral, 3D digital twins, AI change detection, multispectral vegetation and land-cover analysis, and thermal anomaly detection, seven specialized solutions built on the same 20+ satellite constellations, all open below.
Overview
XRTech Group delivers every satellite imagery solution on a single platform, one source for high-resolution optical, hyperspectral, multispectral, SAR, elevation, 3D, change-detection, and thermal data. Search or task imagery over your own area of interest, then turn it into the specific product your project needs, a mineral-probability map, a volumetric report, a deformation alert, or a 3D digital twin.
All Solutions
Every solution is detailed below, full specs, real sample imagery, and a direct quote request, all on this one page. Jump straight to one from the Solutions menu above, or scroll through all seven.
Elevation & Terrain Data
Stereo-derived elevation and terrain data for volumetrics, drainage, and 3D site modeling.
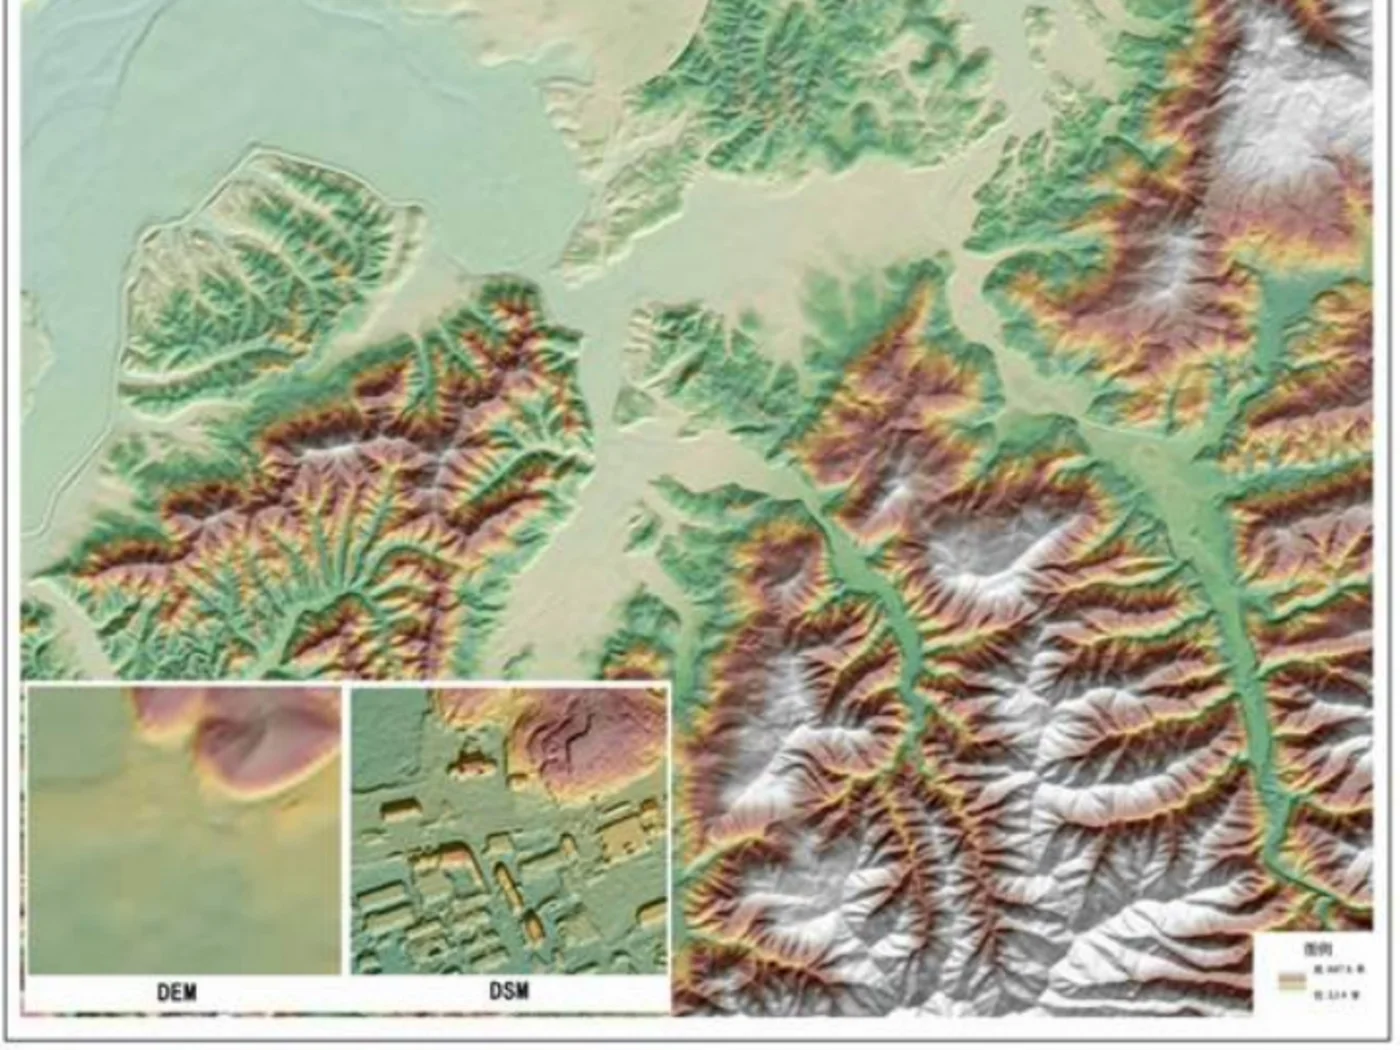
A Digital Elevation Model (DEM) is a bare-earth height map built from stereo satellite imagery, pairs of images captured from slightly different angles and resolved into elevation values, the same way human stereo vision perceives depth. We derive DEMs, and Digital Surface Models (DSMs, which retain buildings, vegetation, and other surface features), from stereo-capable constellations like GF-7 and Beijing-3A, down to 0.5m vertical precision in supported areas.
| Vertical precision | Down to 0.5m, stereo-derived, site dependent |
| Source constellations | GF-7 (≤0.65m PAN + laser altimeter), Beijing-3A, SuperView-1 stereo pairs |
| Typical delivery formats | GeoTIFF, Cloud-Optimized GeoTIFF (COG), point cloud, contour SHP |
| Common uses | Volumetrics, drainage and watershed studies, line-of-sight, DSM/3D base layer |

All-Weather Radar Imagery
Radar imagery that sees through cloud, smoke, and darkness, any weather, day or night.
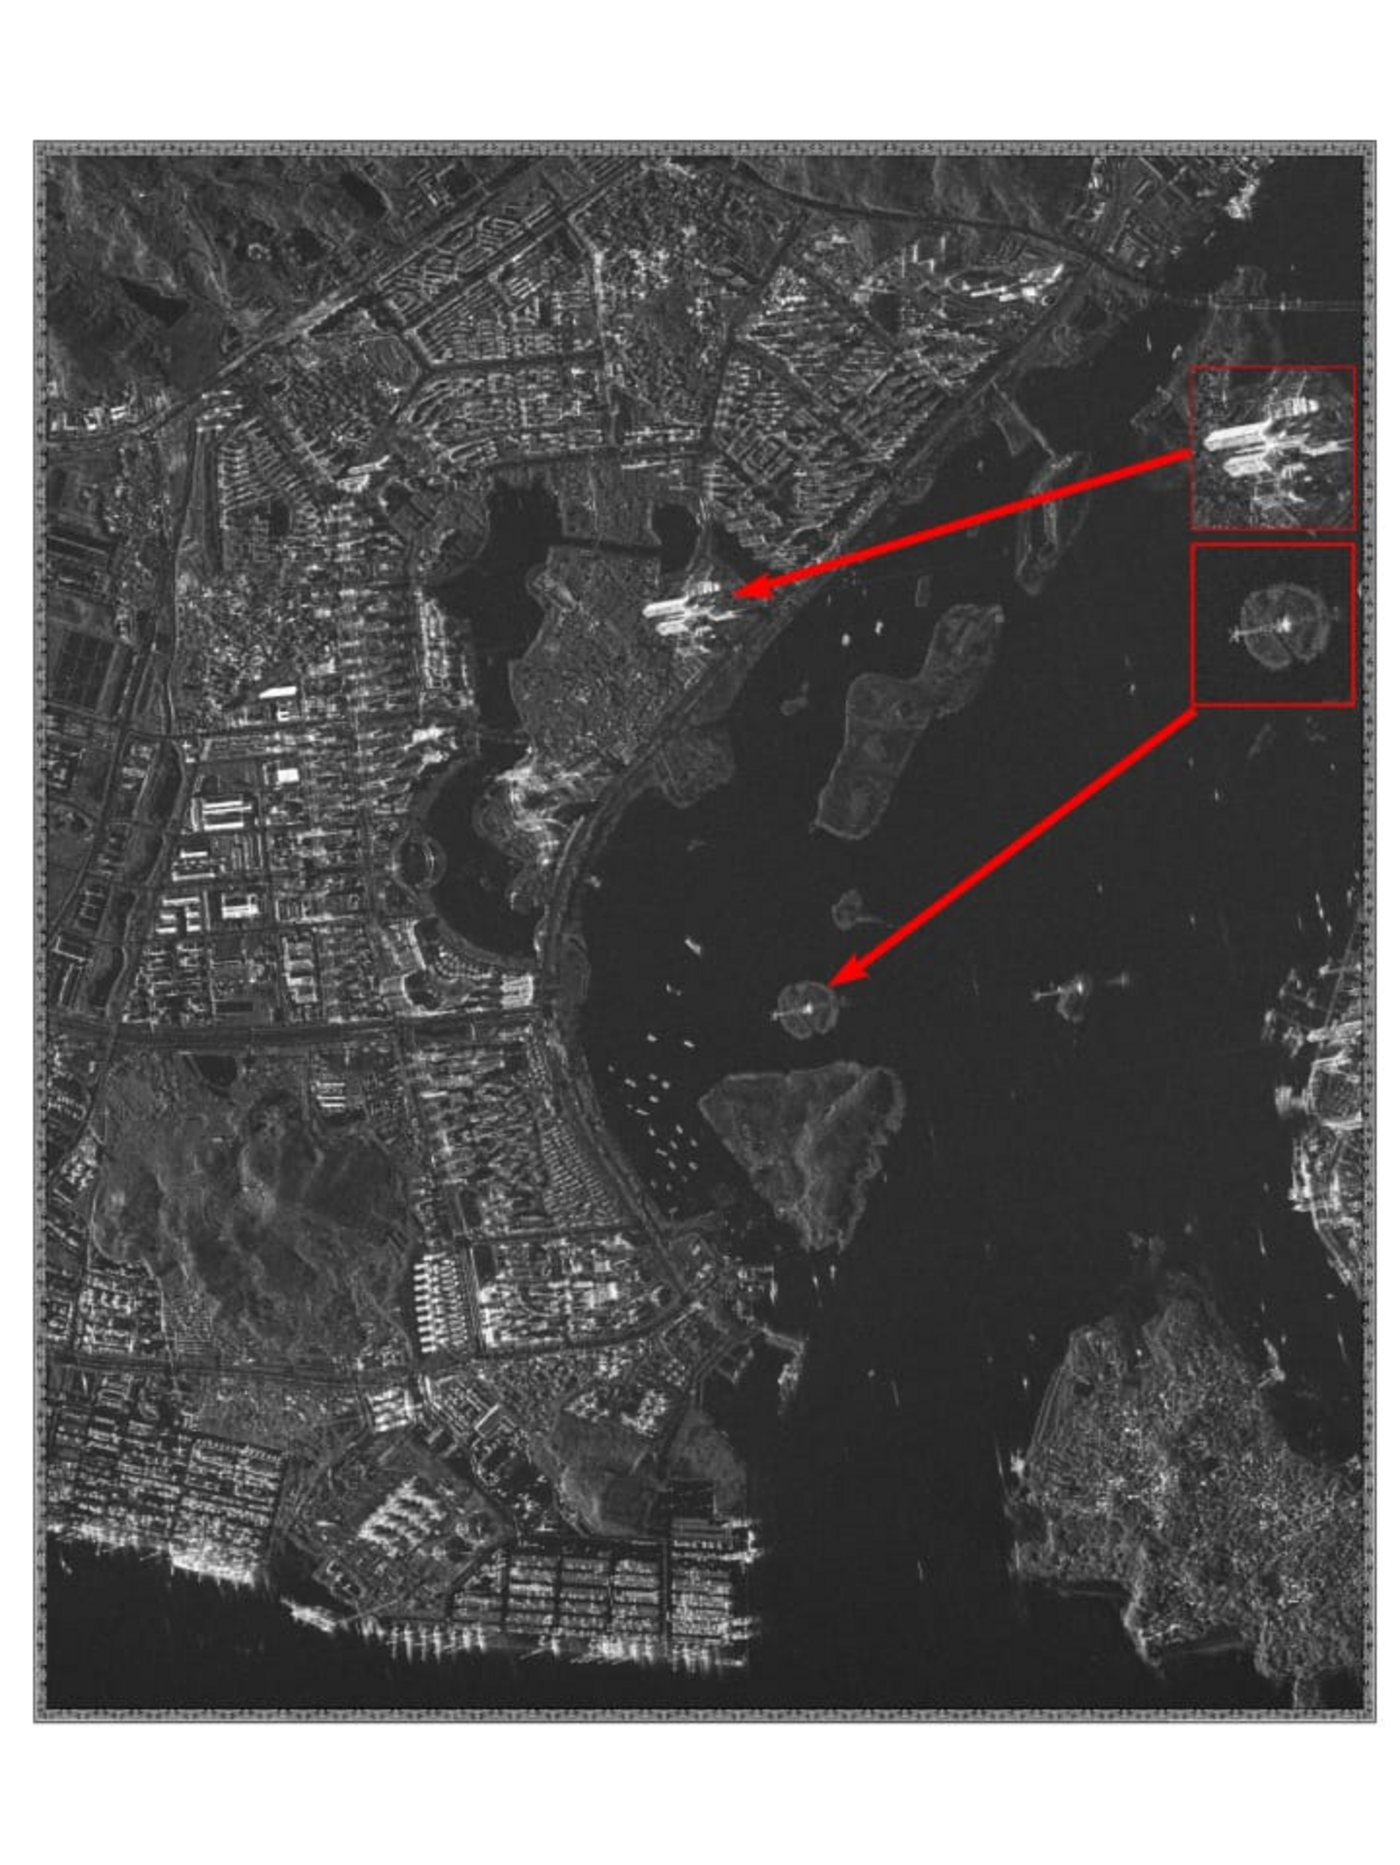
Synthetic Aperture Radar (SAR) sends its own microwave pulses to the ground and measures what bounces back, so it builds an image regardless of cloud cover, smoke, or time of day. We task C-band GF-3 (1m resolution, 12 imaging modes, the most of any SAR satellite in service) and L-band LT-1 (3m resolution, deeper vegetation and soil penetration, down to a 4-day revisit in dual-satellite formation) for the sites where optical imagery can't get a clean capture.
| Resolution range | 1m (GF-3, C-band, Sliding Spotlight) to 3m (LT-1, L-band) |
| Revisit | Down to 4 days in dual-satellite LT-1 formation |
| Band / wavelength | C-band (GF-3) and L-band (LT-1, deeper canopy and soil penetration) |
| Common uses | Flood and disaster response, InSAR deformation, maritime detection, all-weather security monitoring |

Spectral Mineral Fingerprinting
Hundreds of narrow spectral bands that fingerprint surface mineralogy and material composition.
Hyperspectral sensors capture reflectance across hundreds of narrow, continuous bands from roughly 400 to 2500nm, instead of the handful of broad bands a standard camera uses. That spectral resolution lets our Khaza'in exploration platform separate hydroxyl-bearing clays, iron oxides, and other alteration minerals that surround gold, copper, and lithium deposits, using sensors like GF-5B AHSI (330 bands), ZY-1 02D (166 channels), and Wyvern (31-band VNIR, 5.3m).
| Spectral range | ~400-2500nm, across hundreds of continuous bands |
| Source sensors | GF-5 / GF-5B AHSI (330 bands, 30m), ZY-1 02D (166 channels), Wyvern (31-band VNIR, 5.3m) |
| Khaza'in volume pricing | $20/km² under 100km², down to $12/km² over 2,000km² |
| Common uses | Mineral exploration and targeting, lithology mapping, vegetation chemistry, material classification |


Digital Twins & 3D City Models
Photorealistic 3D city models and terrain digital twins built from stereo satellite imagery.
3D models turn stereo-derived elevation data and high-resolution optical imagery into textured, measurable digital twins, from simple white-model building massing for early planning, to fully photorealistic city models for simulation and visualization. The same stereo pairs used to build a DEM/DSM (GF-7, Beijing-3A, SuperView-1) are the input; what changes is how far the processing goes, from bare terrain, to building footprints, to a textured, photorealistic render.
| Output tiers | White-model massing, textured LOD2/LOD3 buildings, fully photorealistic digital twin |
| Source data | Stereo-derived DSM + high-resolution optical texture (GF-7, Beijing-3A, SuperView-1/Neo) |
| Typical delivery | 3D Tiles, OBJ/FBX mesh, CityGML, GeoTIFF DSM |
| Common uses | Urban planning, smart-city digital twins, infrastructure and pipeline scenario modeling |


AI-Powered Before/After Monitoring
Automated before/after comparison that flags new construction, clearing, or disturbance between captures.
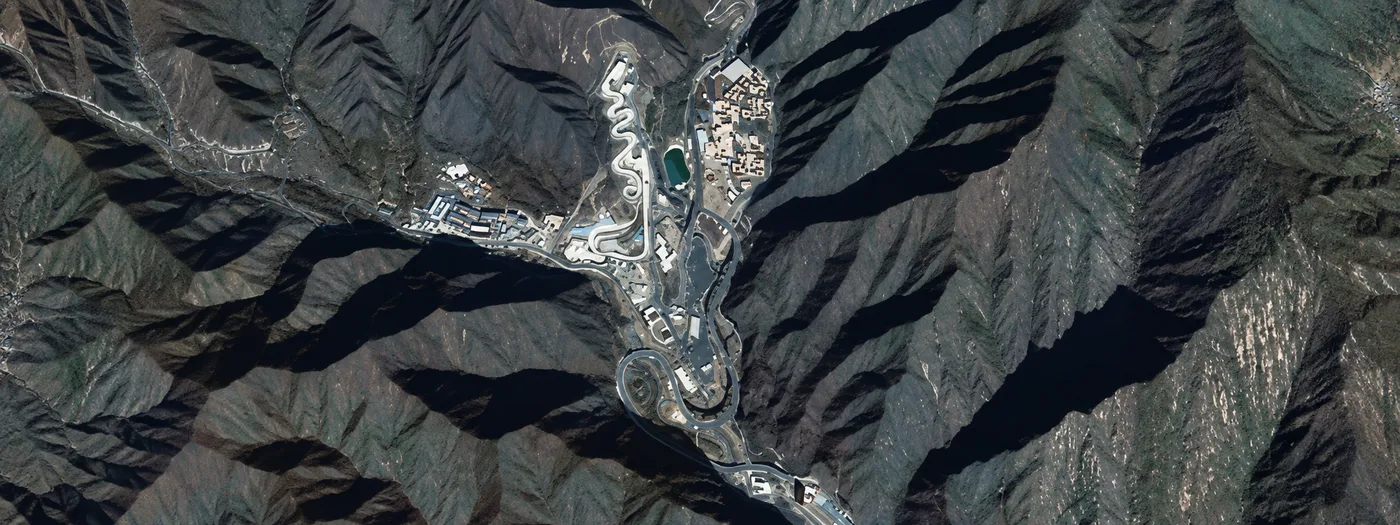
Change detection compares two or more captures of the same area and automatically flags what's different, new construction, vegetation loss, excavation, or unauthorized activity, instead of a human analyst scanning both images side by side. We run this as an AI-assisted layer on top of scheduled optical and SAR tasking, so a site under repeat observation gets a running, timestamped log of what changed and when.
| Method | AI-assisted pixel- and object-level comparison across repeat captures, optical and/or SAR |
| Minimum useful cadence | Depends on the question — weekly for active construction, monthly to seasonal for land-cover change |
| Typical delivery | Before/after image pairs, change-flag GeoJSON/SHP layers, summary report |
| Common uses | Construction monitoring, illegal-activity detection, disaster damage assessment, compliance evidence |


Beyond Visible Light
Reflectance across red-edge, near-infrared, and other bands beyond what the human eye sees.
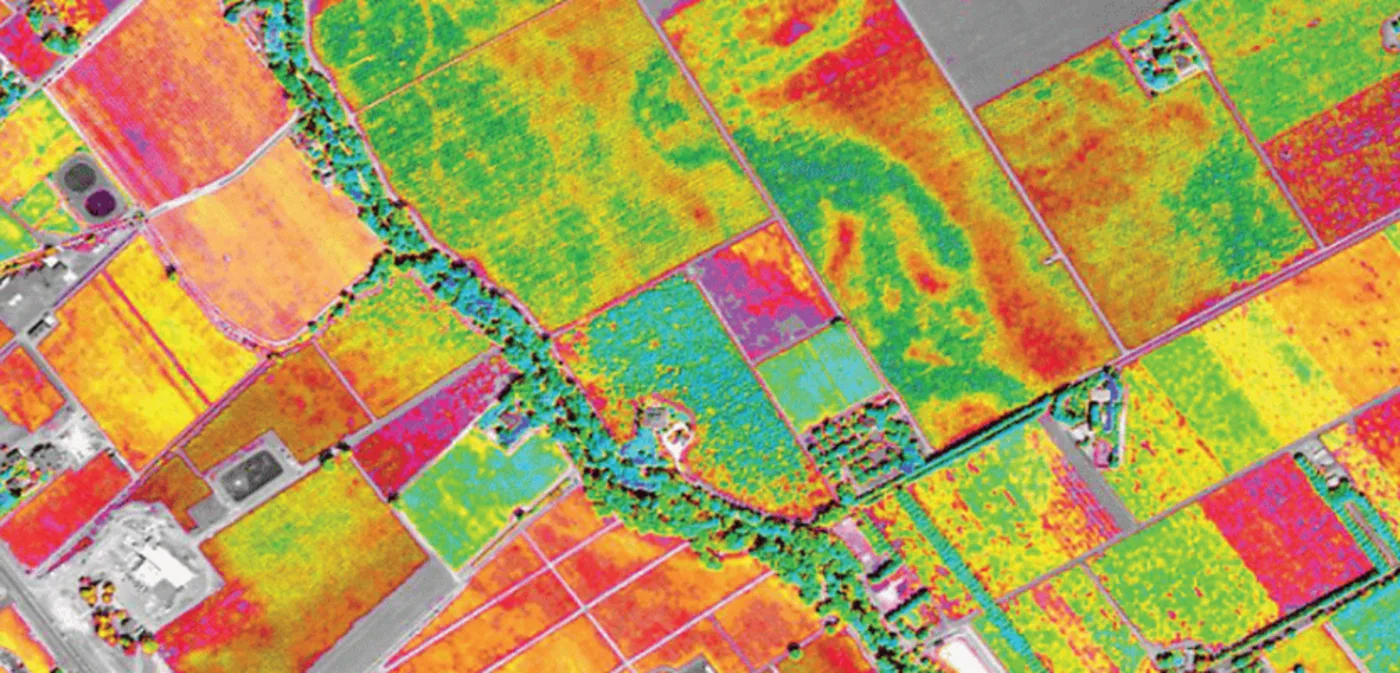
Multispectral imagery captures reflectance in a handful of discrete bands beyond standard red, green, and blue, most often red-edge and near-infrared, enough to compute vegetation indices, separate alteration zones, and classify land cover, without the cost of a full hyperspectral capture. Our multispectral fleet spans SuperView-2 (0.42m, 1+8 bands including Red Edge and Yellow) down to wide-swath GF-6 (8m, built for precision agriculture) and GF-1 (16m, 830km swath).
| Resolution range | 1-1.2m (SuperView Neo-1) to 16m wide-swath (GF-1 WFI) |
| Typical bands | Blue, Green, Red, Red Edge, NIR — some sensors add Purple/Yellow |
| Source constellations | SuperView Neo-1/-2, Beijing-3A, GF-6 (agriculture specialist), GF-1/B/C/D |
| Common uses | Precision agriculture, vegetation health, land-cover classification, early-stage mineral screening |
Heat & Thermal Anomaly Detection
Surface-temperature data for heat anomalies, gas monitoring, and thermal stress detection.
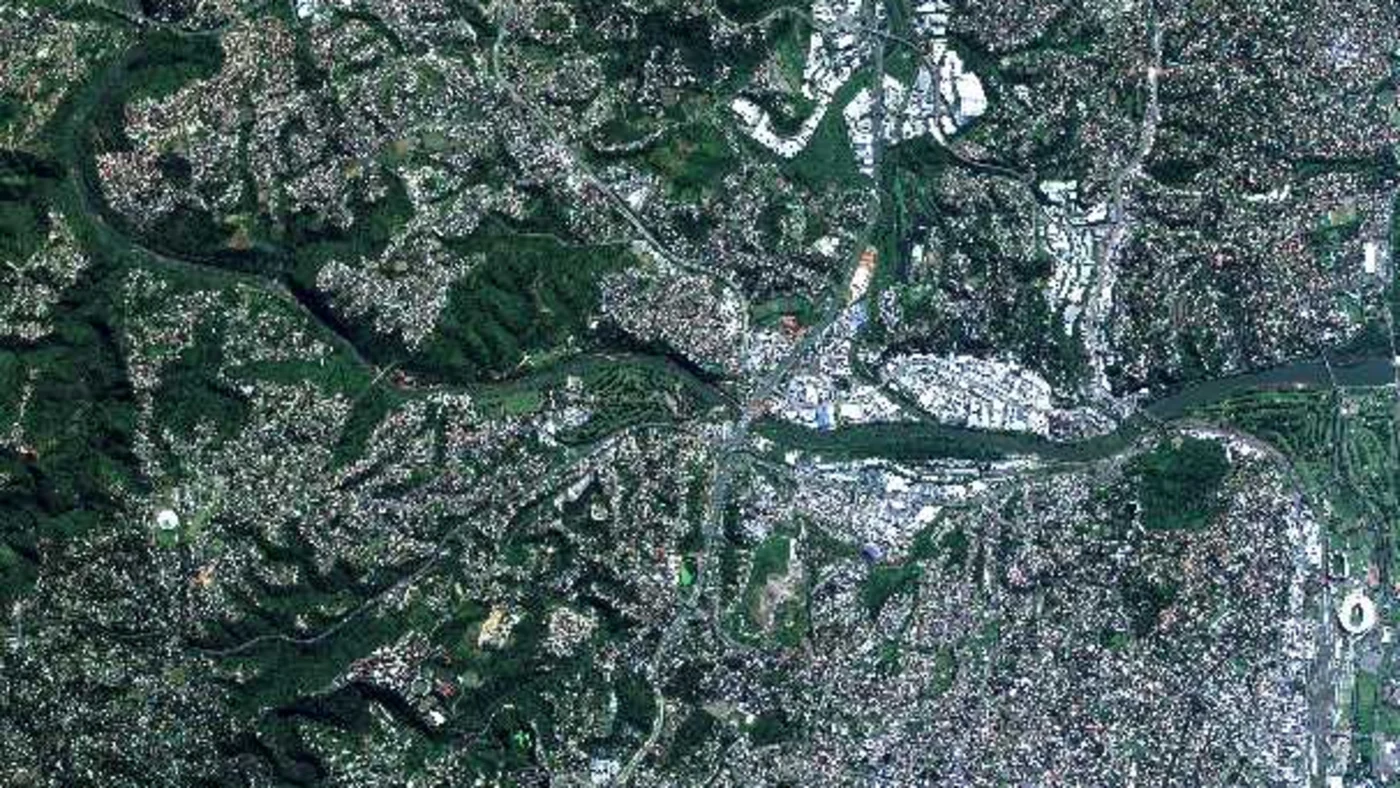
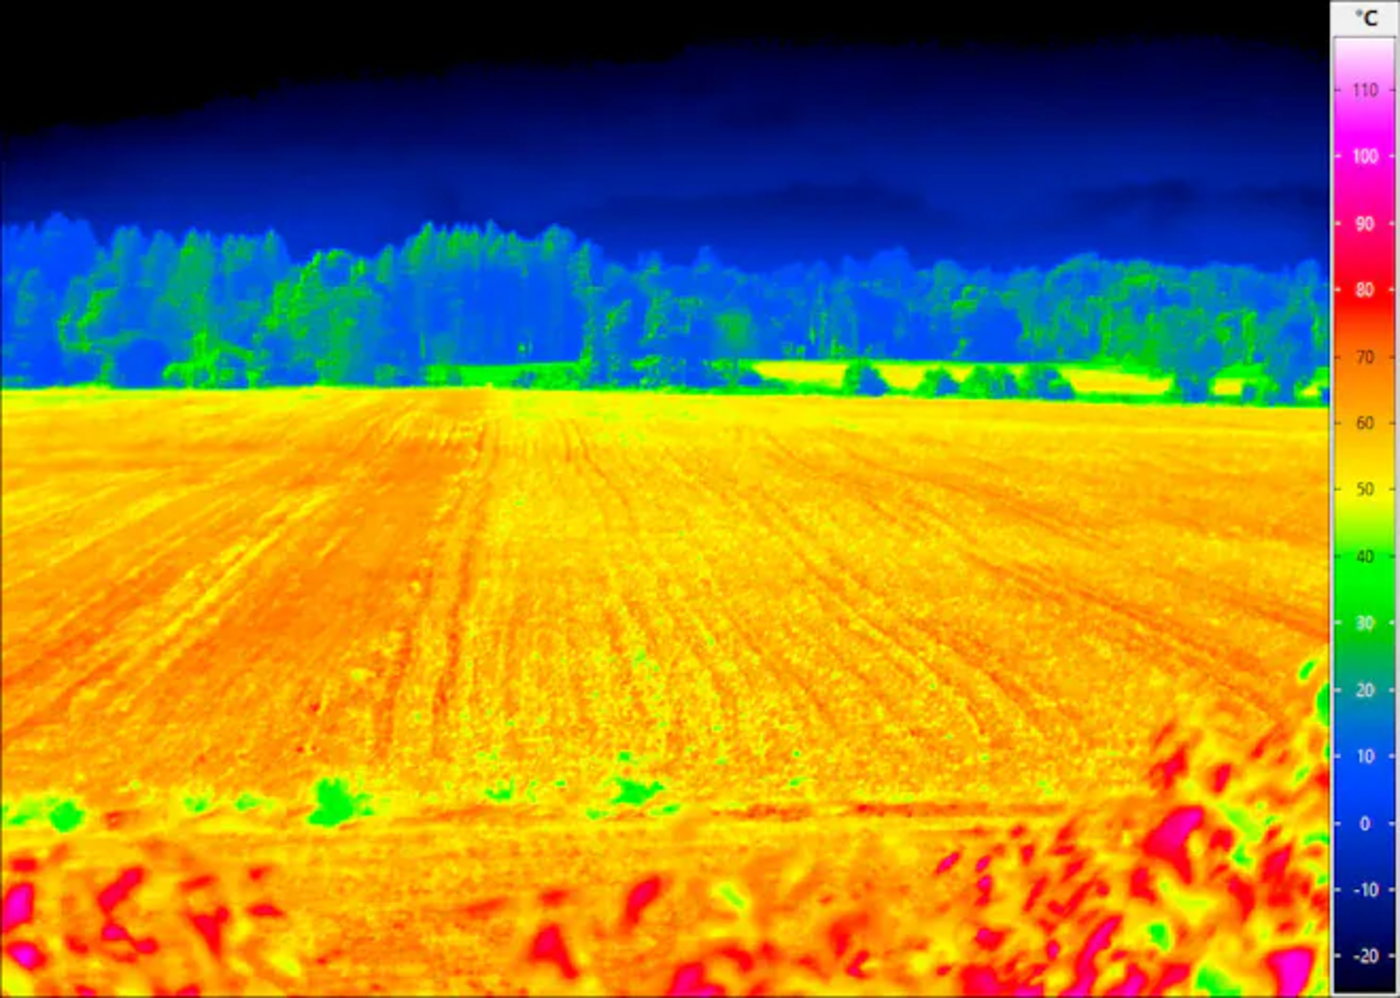
Thermal sensors measure emitted infrared radiation rather than reflected light, turning surface temperature into an image. Our thermal coverage runs through GF-5B's VIMS payload (MWIR 3.5-3.9µm / LWIR 8.0-12.5µm, on the same satellite platform family used for hyperspectral AHSI), the geostationary GF-4 (a continuous regional staring sensor, updated every 20 seconds), and SJ-9B (73m LWIR), for anomalies that don't show up in a standard optical capture.
| Resolution range | 20m (VIS/SWIR) to 400m (GF-4 MWIR, geostationary), depending on sensor |
| Source sensors | GF-5B VIMS (MWIR/LWIR), GF-4 (geostationary, 20-second update), SJ-9B (73m LWIR) |
| Typical delivery | Georeferenced thermal GeoTIFF, anomaly-flagged overlay |
| Common uses | Gas and flare monitoring, thermal pollution tracking, urban heat mapping, subsurface fire detection |
Who It's For
The same seven solutions support different decisions depending on who is looking at them.
Use hyperspectral and multispectral imagery to screen a tenure for alteration and structural targets before committing a drill budget.
Track pit progression, stockpile volumes, and construction progress with DEM, 3D models, and change detection.
Use SAR and InSAR to monitor deformation on dams, slopes, and structures, and catch risk before it becomes a claim.
Build 3D city digital twins and terrain models for planning, simulation, and line-of-sight studies.
Track crop health, vegetation chemistry, and water quality with multispectral and hyperspectral imagery.
Monitor thermal anomalies, unauthorized activity, and land-cover change for compliance and ESG reporting.
Pricing & Delivery
Transparent per-km² pricing for archive and new-tasking optical imagery, volume pricing for hyperspectral, and a fast custom quote for SAR, DEM, 3D, and thermal. Not sure what you need? Open the quote form and tell us your area and goal.
Existing optical or multispectral imagery, ready to download within minutes
Minimum order area 25km² per scene.
Fresh capture of your exact site and date range, optical, multispectral, or SAR
Minimum order area 100km² per scene. Priority tasking available for time-sensitive requests.
Hyperspectral runs on Khaza'in's volume pricing; SAR, DEM, 3D, and thermal are quoted per project
These depend on sensor availability, processing depth, and area, send us your AOI and we reply with a firm quote.
Quick Enquiry
Tell us your area of interest and what you're trying to answer, exploration, monitoring, planning, or compliance, and we'll recommend the right sensor and solution.
Thanks — we'll get back to you by email shortly.
Ready to Find the Right Solution?
Search our live archive, request new tasking, or send us your area of interest for a custom quote.
