Satellite Imagery for Disaster Monitoring & Response
Satellite imagery for disaster monitoring supports every stage of an emergency, from flood and wildfire tracking to earthquake deformation and landslide response. A fleet of 130+ satellites spanning very high-resolution optical, all-weather SAR, hyperspectral, and geostationary sensors helps emergency managers, insurers, and relief organizations see a disaster clearly while it is still unfolding.
XRTech Group delivers disaster monitoring satellite imagery and the analytics built on top of it on a single platform, one source of very high-resolution optical, all-weather SAR, hyperspectral, and geostationary data spanning preparedness, emergency response, and recovery. Search or task imagery over an affected area, then turn it into waterline maps, burn perimeters, deformation alerts, and damage-classification reports.
What is disaster monitoring satellite imagery?
Disaster monitoring satellite imagery is satellite-derived Earth observation data, optical, SAR, hyperspectral, and geostationary data, used to prepare for, respond to, and recover from floods, wildfires, earthquakes, landslides, and oil spills. A fleet combining sub-meter optical detail, cloud-penetrating radar, and continuous geostationary staring lets responders compare an affected area against itself over time instead of relying on scattered ground reports alone.
How is satellite imagery used in disaster management?
Satellite imagery is used in disaster management to map flood extent and waterlines, track wildfire ignitions and smoke plumes, monitor earthquake and infrastructure deformation, direct landslide and geohazard response, detect marine oil spills, and feed a unified AI emergency command platform. A single high-resolution capture can separate damaged structures from intact ones across an entire neighborhood, and comparing captures over time turns that snapshot into a recovery record.
130+Satellites across optical, SAR, hyperspectral & geostationary
20-SecGeostationary refresh for continuous wildfire tracking
1-2mmInSAR ground-deformation accuracy for dam & slope safety
<24 HrsTypical emergency-tasking delivery after an event
Response Cycle
How Satellite Imagery Supports the Disaster Management Cycle
Satellite imagery supports disaster management from preparedness through active response to recovery, one dataset instead of a different record for every stage.
Prepare — Archive imagery, flood and fire risk layers, and historical change analysis build a baseline of what a flood plain, fault zone, or fire-prone slope looked like before anything happened.
Respond — Emergency tasking cuts through cloud cover, smoke, and darkness to deliver analysis-ready imagery within 24 hours, mapping waterlines, burn perimeters, and structural damage while a response is still being organized.
Recover — Repeat captures measure rebuilding progress, support insurance and grant claims with timestamped evidence, and feed back into the next risk model for the area.
Process
How It Works
From a defined disaster area to analysis-ready products in your command center, one pipeline for every capture.
Define the Disaster Area & Need — Draw or upload the affected boundary and tell us what you need, flood extent, fire perimeter, structural deformation, or a general damage assessment, as soon as an event happens.
Task Emergency Collection or Pull Archive — We search archive imagery across 130+ satellite constellations and task emergency-priority collection where fresh imagery is needed, with SAR available when cloud cover rules out optical.
Process to Analysis-Ready Products — Captures are orthorectified, pansharpened, and run through AI change detection to produce waterline maps, burn perimeters, deformation layers, and building-level damage classifications.
Deliver to Your Command Center — Products land in ArcGIS, QGIS, S3, or SFTP, in GeoTIFF, SHP, DWG, or IMG format, the way your emergency operations center already works.
Fleet
Our Satellite Fleet
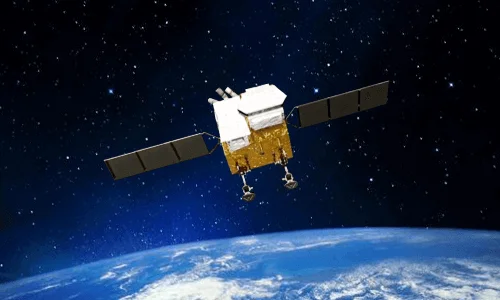
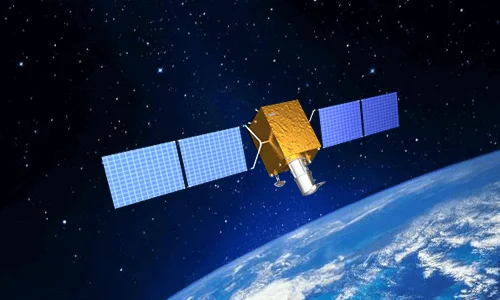
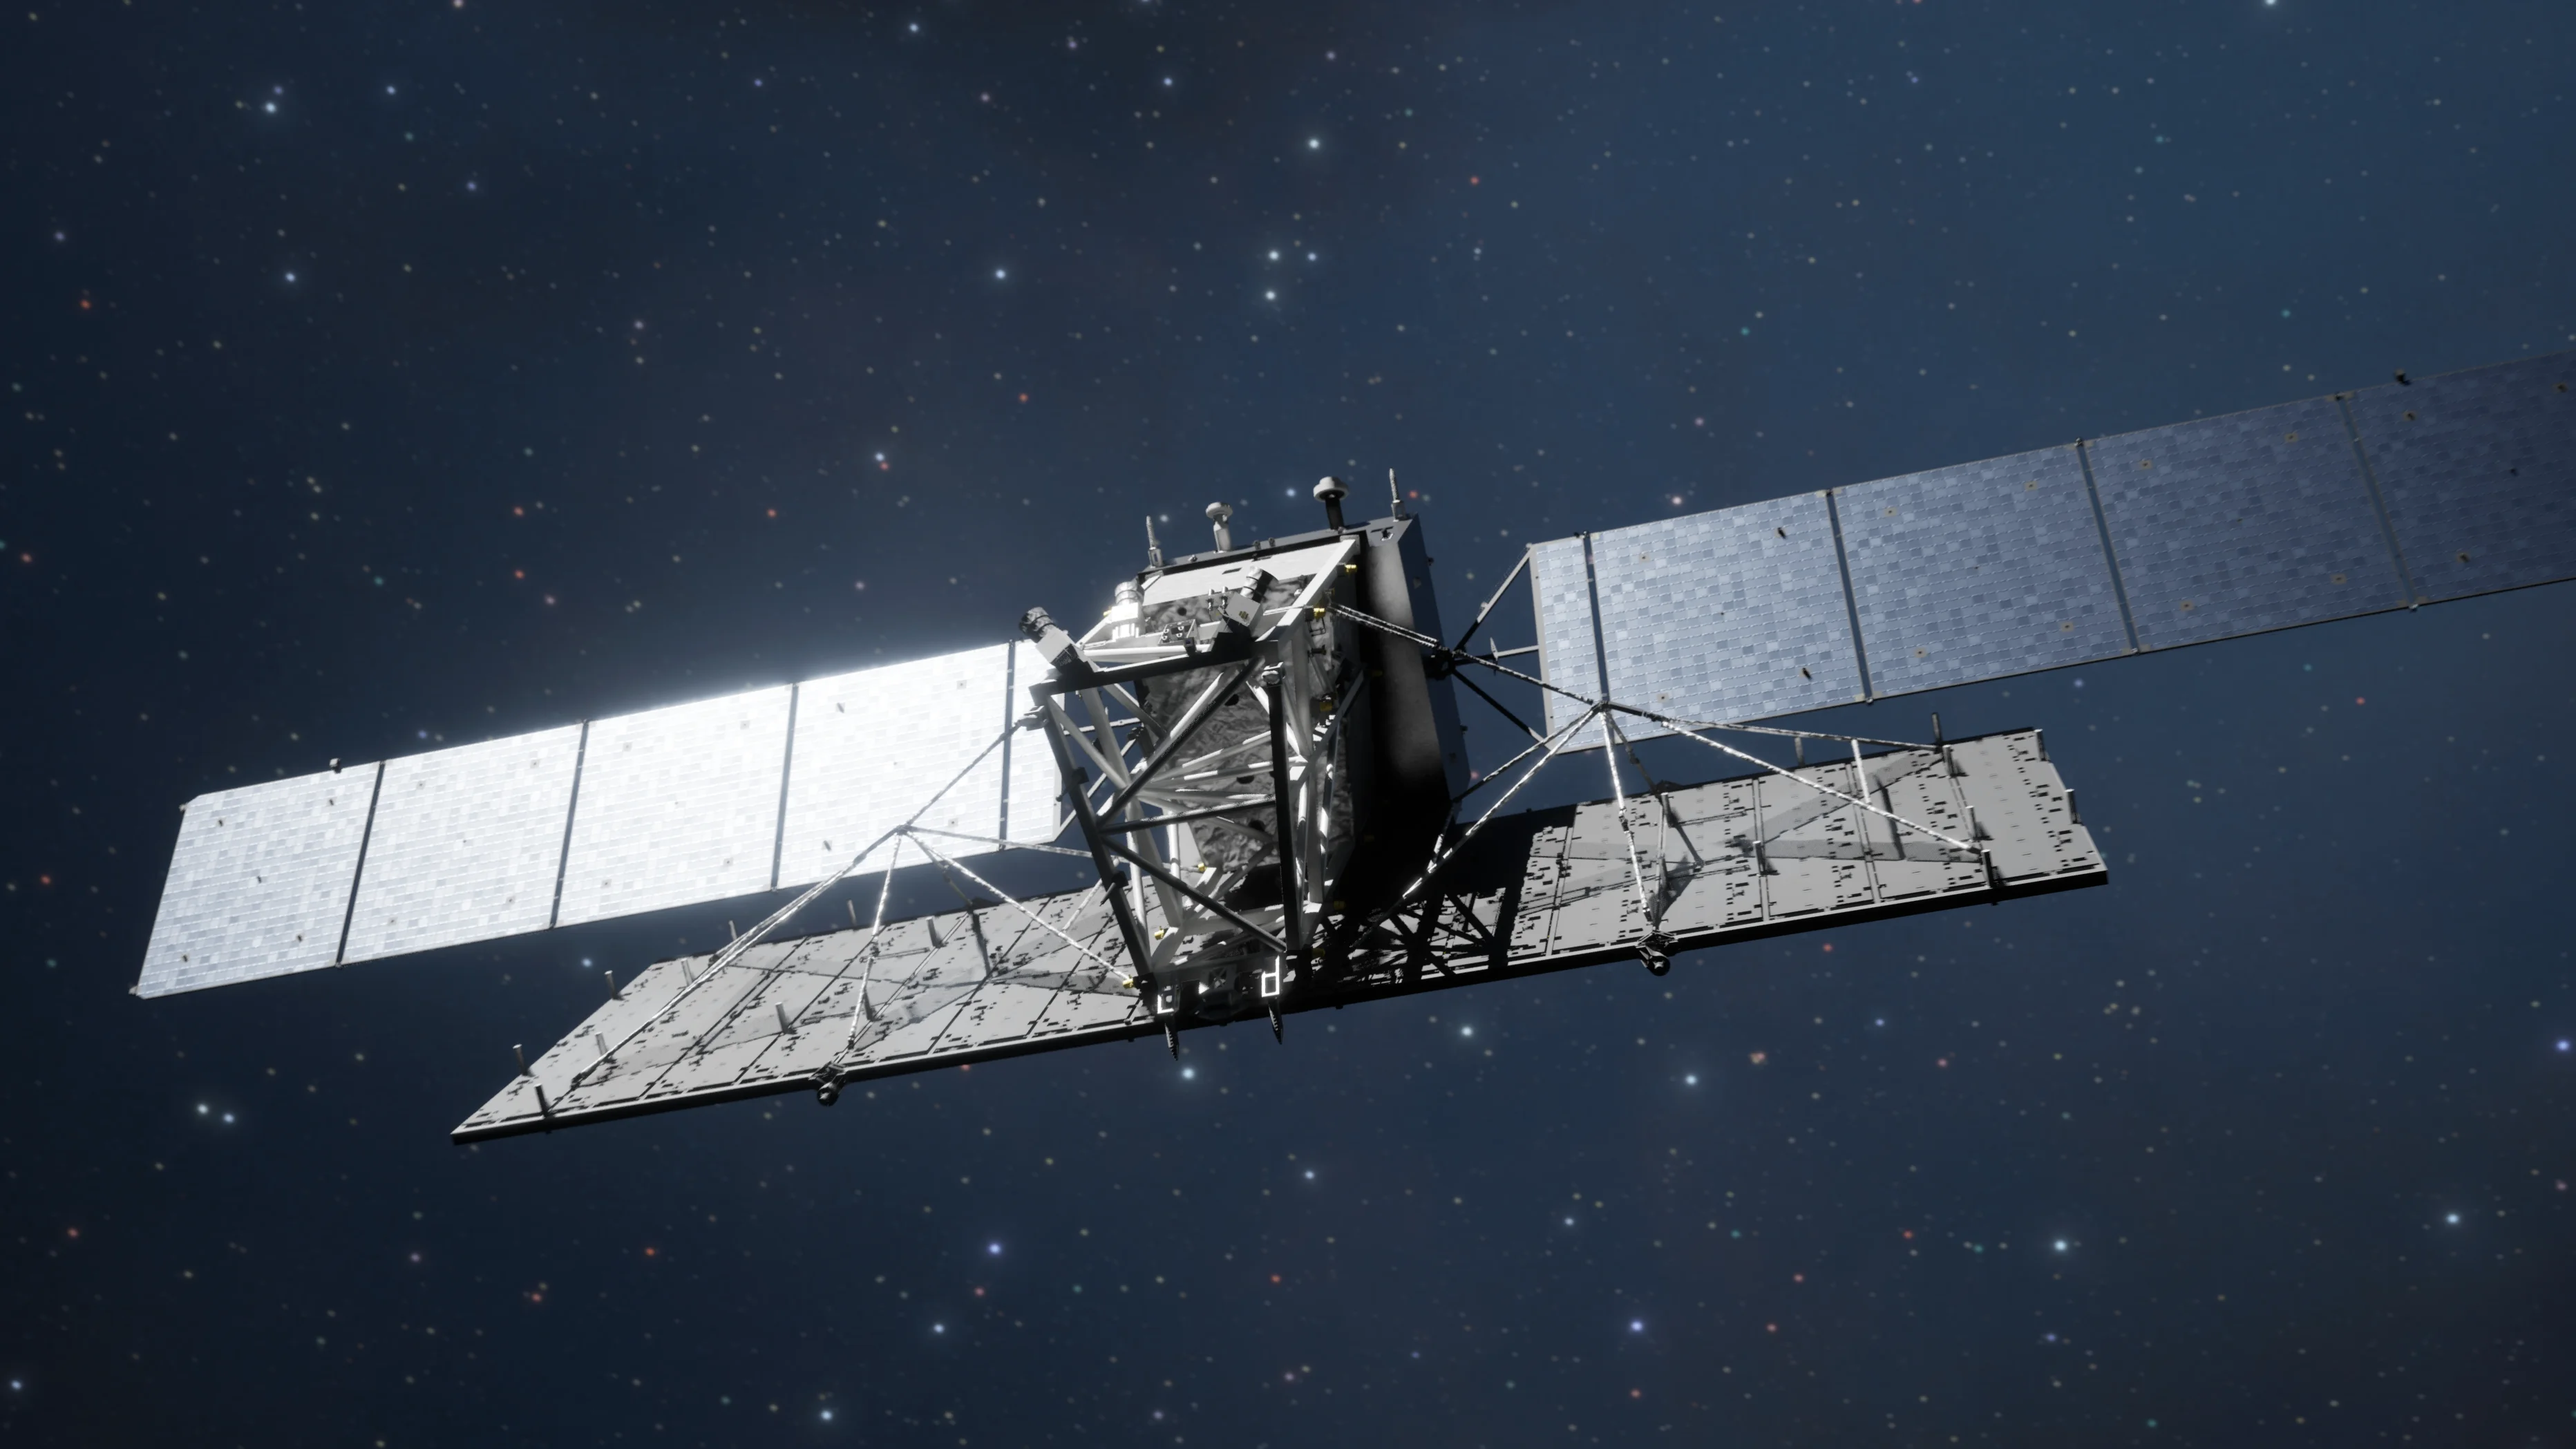
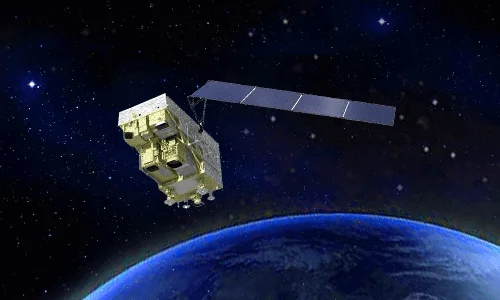
A fleet of over 130 satellites spanning sub-meter optical, geostationary, all-weather radar, and hyperspectral sensors, each matched to a specific disaster-monitoring task.
VHR Optical · 0.25m – 0.3m PAN
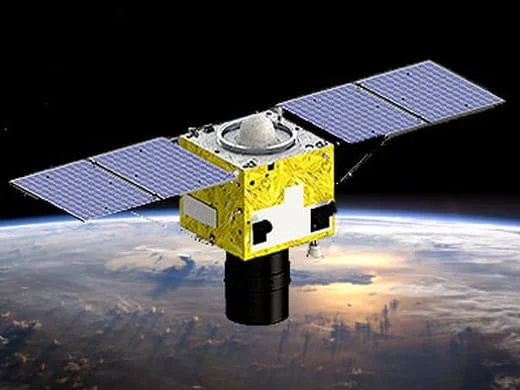
SuperView Neo-1 (01-04)
Delivers 0.25m to 0.3m panchromatic and 1.2m multispectral imagery with daily revisit capabilities at mid and high latitudes.
VHR Optical · 0.42m – 0.5m PAN
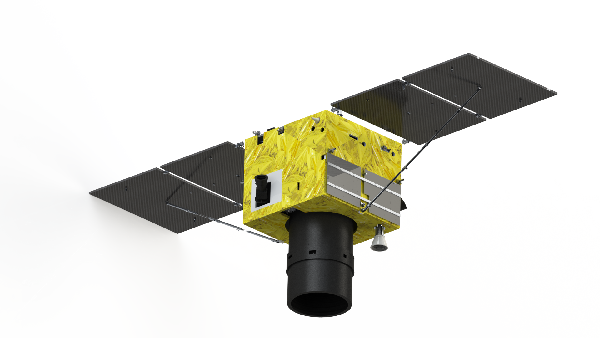
SuperView-1 (01-04) & SuperView-2 (GFDM)
SuperView-1 provides 0.5m PAN and 2m MS imagery across a 12km swath with agile multi-strip, long-strip, and stereo collection modes. SuperView-2 features 0.42m PAN and a 1+8 spectral band configuration (Panchromatic, Purple, Blue, Green, Yellow, Red, Red Edge, NIR1, NIR2) for evaluating crop damage, soil erosion, and environmental stress.
VHR Optical · ≤0.65m PAN
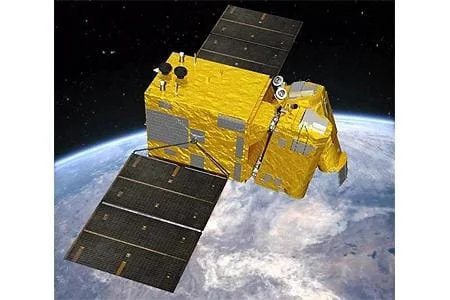
GF-7
A sub-meter stereo mapping satellite (≤0.65m PAN / 2.6m MS) equipped with a dual-linear CCD camera and laser altimeter for 1:10,000-scale 3D elevation modeling.
Wide-Swath Optical · 2m – 16m
GF-6
Offers 2m PAN / 8m MS imagery across a 90km swath and 16m wide-field imaging across an 800km swath, with dedicated Red Edge bands (690 to 770nm).
Geostationary · 50m VNIR
GF-4
Positioned in geostationary orbit at 36,000km altitude, delivering 50m VNIR and 400m Mid-Wave Infrared (MWIR) imagery with an ultra-fast 20-second refresh rate for continuous real-time regional monitoring.
All-Weather SAR · 1m
GF-3 Constellation (C-band SAR)
Features 1m resolution in Spotlight mode across 12 imaging modes (Spotlight, Stripmap, ScanSAR) with single, dual, or full Quad-Polarization (HH, HV, VV, VH), penetrating heavy cloud cover, tropical fog, monsoons, smoke, and night darkness.
All-Weather SAR · 3m – 30m
LT-1 Constellation A/B (L-band SAR)
Dual L-band formation-flying satellites providing 3m to 30m resolution for InSAR millimeter-level surface deformation tracking (1 to 2mm accuracy) and global DEM generation.
Hyperspectral · 30m / 330 bands
GF-5 / GF-5B
Captures 30m hyperspectral data across 330 spectral channels (400 to 2500nm) to detect chemical leaks, greenhouse gas emissions, and water pollution.
Hyperspectral · 2.5m / 166 bands
ZY-1 02D / 02E
Combines 30m hyperspectral data across 166 channels with a 2.5m panchromatic camera.
Examples
Disaster Monitoring Satellite Images
Real capture examples across sensor types, from cloud-penetrating radar during monsoon season to a wildfire burn-area monitoring map.
SAR imagery over Sri Lanka captured cloud-free during the Northeast Monsoon, when optical tasking would have been blocked out entirely.A GF-1 monitoring map from a forest fire in Xichang City, Sichuan Province, outlining a 3,446-hectare burned area for response teams.GF-3 C-band SAR tracing flood extent along a river basin in China, imaged through cloud cover that optical satellites could not clear.A mapped inundation extent overlaid on satellite imagery, with a ground photo confirming the flooded area on the day of capture.
Who It's For
Who Uses Disaster Monitoring Satellite Imagery?
The same imagery supports different decisions depending on who is looking at it.
Emergency Management & Civil Defense
Get a fast, wide-area picture of flood extent, fire perimeter, or earthquake damage to direct resources before ground teams can cover the same area.
Disaster Response NGOs & Relief Organizations
Prioritize where to send relief teams and supplies using damage maps built within hours, not days, of an event.
Insurance & Reinsurance Companies
Validate claims with timestamped, independent before-and-after imagery that holds up without a site adjuster visiting every property.
Government & Regulatory Agencies
Run quarterly dam, bridge, and critical-infrastructure deformation checks and keep a defensible public safety record.
Infrastructure Operators & Utilities
Monitor pipelines, power corridors, dams, and transport links for ground movement and storm damage across a wide service territory.
Solutions
Satellite-Based Disaster Management Solutions
From flood response to an integrated AI emergency command platform, satellite data and AI analytics support every stage of disaster management.
Flooded building clusters marked directly on a satellite capture, next to a ground photo of the same event.
01 — SOLUTION
Flood Monitoring & Emergency Waterline Mapping
Floodwater does not wait for clear skies, so the imagery used to map it has to work through storm cloud as reliably as it does on a clear day.
Real-Time Waterline Mapping: Optical imagery and cloud-penetrating SAR are combined to trace flood extent and waterlines as an event unfolds, not just after the storm clears.
Inundation Prediction & Evacuation Modeling: AI analytics model likely inundation zones and safe evacuation routes from the mapped extent, giving responders a route plan instead of just a flood outline.
All-Weather Flood Detection: GF-3 C-band and LT-1 L-band SAR see through heavy cloud, tropical fog, and monsoon rain, exactly the conditions a flood-causing storm produces.
Rapid Delivery: Clear waterline mapping and evacuation modeling can be delivered within 24 hours of tasking, detailed further in the field examples below.
02 — SOLUTION
Space-Air-Ground Integrated Forest Fire Platform
A wildfire changes by the hour, so tracking one well means combining a satellite that never looks away with the data that explains where it will spread next.
Real-Time Ignition Detection: Geostationary GF-4 imaging stares at the same region continuously, refreshing roughly every 20 seconds, catching new ignition points far faster than a satellite that only passes overhead once a day.
Smoke Plume & Spread Tracking: Repeated geostationary captures turn into a time-lapse of smoke plume direction and fire-front movement, shown in the gallery below.
Vegetation Health & Fuel-Load Assessment: Pre-fire NDVI and vegetation-dryness indices flag high fuel-load areas before a season starts, so watch priorities can be set ahead of time.
Post-Fire Damage Mapping: High-resolution optical imagery after the fire measures the exact burned-area footprint for recovery and rehabilitation planning.
Ground movement that leads to a structural failure almost always starts long before the failure itself, the question is whether anyone is measuring it.
Millimeter-Level Deformation Detection: Interferometric SAR (InSAR) compares the radar phase between repeat satellite passes to detect subtle ground and structural deformation at 1-2mm accuracy.
Dam & Critical Infrastructure Monitoring: Routine InSAR passes over dams, bridges, and power plants catch slow deformation trends before they become a breach or a structural failure, including the quarterly program covered in the field examples below.
Post-Earthquake Structural Assessment: Rapid post-event optical and SAR tasking surveys affected buildings and infrastructure for structural assessment ahead of a full ground inspection.
Transportation Network Safety: The same deformation monitoring extends to rail lines, highways, and tunnels, flagging subsidence or slope movement before it interrupts a route.
04 — SOLUTION
Landslide & Geohazard Response
A slope failure rarely gives much warning on the ground, but satellite tasking can still get responders the picture they need within hours of one happening.
Rapid Post-Event Tasking: High-resolution imagery is tasked and delivered rapidly after a slope failure, timely disaster and damage assessment detailed in the field examples below.
Volume Displacement Calculation: Stereo-derived elevation models compare pre- and post-event terrain to calculate how much material actually moved.
Ground Team Direction: Mapped debris fields and access-road status direct rescue and recovery teams to where they are needed instead of searching blind.
Geohazard Susceptibility Mapping: Slope, drainage, and historical movement data combine into susceptibility maps that flag the next at-risk area before it fails.
05 — SOLUTION
Marine Oil Spill Detection & Tracking
An oil slick spreads whether or not anyone can see it, which is exactly the gap all-weather radar is built to close.
All-Weather Spill Detection: GF-3 and LT-1 SAR automatically identify ocean-surface oil slicks day or night, in conditions that would ground an optical tasking request entirely.
Spill Evolution Modeling: Radar-detected slick boundaries are fused with ocean current models to predict how a spill will move and where containment should be placed.
Rapid Emergency Tasking: A past emergency tasking operation processed more than 90 SAR scenes in just four days to support cleanup coordination for a single spill event.
06 — SOLUTION
Integrated AI Emergency Command Platform
A disaster response rarely runs on satellite imagery alone, so the imagery is built to plug straight into the rest of the response stack.
Multi-Source Data Fusion: Satellite imagery, autonomous drone-in-a-box feeds from systems like DJI Dock 2 and Autel EVO Nest, and ground IoT sensors combine into one operating picture instead of three separate ones.
Unified Command Dashboard: Every data source lands in a single dashboard, so an emergency operations center is not switching between a satellite portal, a drone app, and a sensor feed mid-response.
Priority & Emergency Tasking Built In: The same portal used for routine archive search includes dedicated priority and emergency tasking options with a defined lead time, so a time-critical request does not get lost in a standard order queue.
Imagery Types
What Type of Satellite Imagery Is Best for Disaster Monitoring?
Different sensor types answer different disaster-monitoring questions, and most response programs end up combining more than one.
Imagery Type
What It Reveals
Best For
Very High-Resolution Optical
Sharp, true-color detail down to individual buildings and vehicles
Chemical leak and gas-emission detection, water pollution, post-fire vegetation stress
Deliverables
The Outputs We Deliver
Every engagement includes elevation models, orthophoto maps, and AI-derived analysis layers, not just raw imagery.
Elevation Models (DEM / DSM / DTM)
Delivered at 2-10m grid spacing with ±3m vertical RMSE precision, built for hydrological and flood modeling.
Digital Orthophoto Maps (DOM)
Orthorectified imagery aligned to 50cm spatial resolution with 8m CE90 positional precision.
AI Computer Vision Layers
Automated change detection, semantic segmentation of damaged structures and water-body expansion, and target identification.
GIS-Ready File Formats
Delivered in GeoTIFF, SHP, DWG, or IMG format in WGS84 or UTM projections, by cloud download or physical HDD.
Field Examples
Disaster Response in Practice
Real deployments show what satellite-based disaster monitoring looks like once an event is underway.
Flood Response · Derna, Libya
Mapping a Coastal Flood Disaster Within 24 Hours
After catastrophic dam-collapse flooding struck Derna, Libya, SAR-based damage assessment delivered clear waterline mapping and evacuation-route modeling within 24 hours, supporting the response effort while conditions on the ground were still changing.
Infrastructure Safety · Aswan Dam, Egypt
Quarterly Deformation Checks on a Major Dam
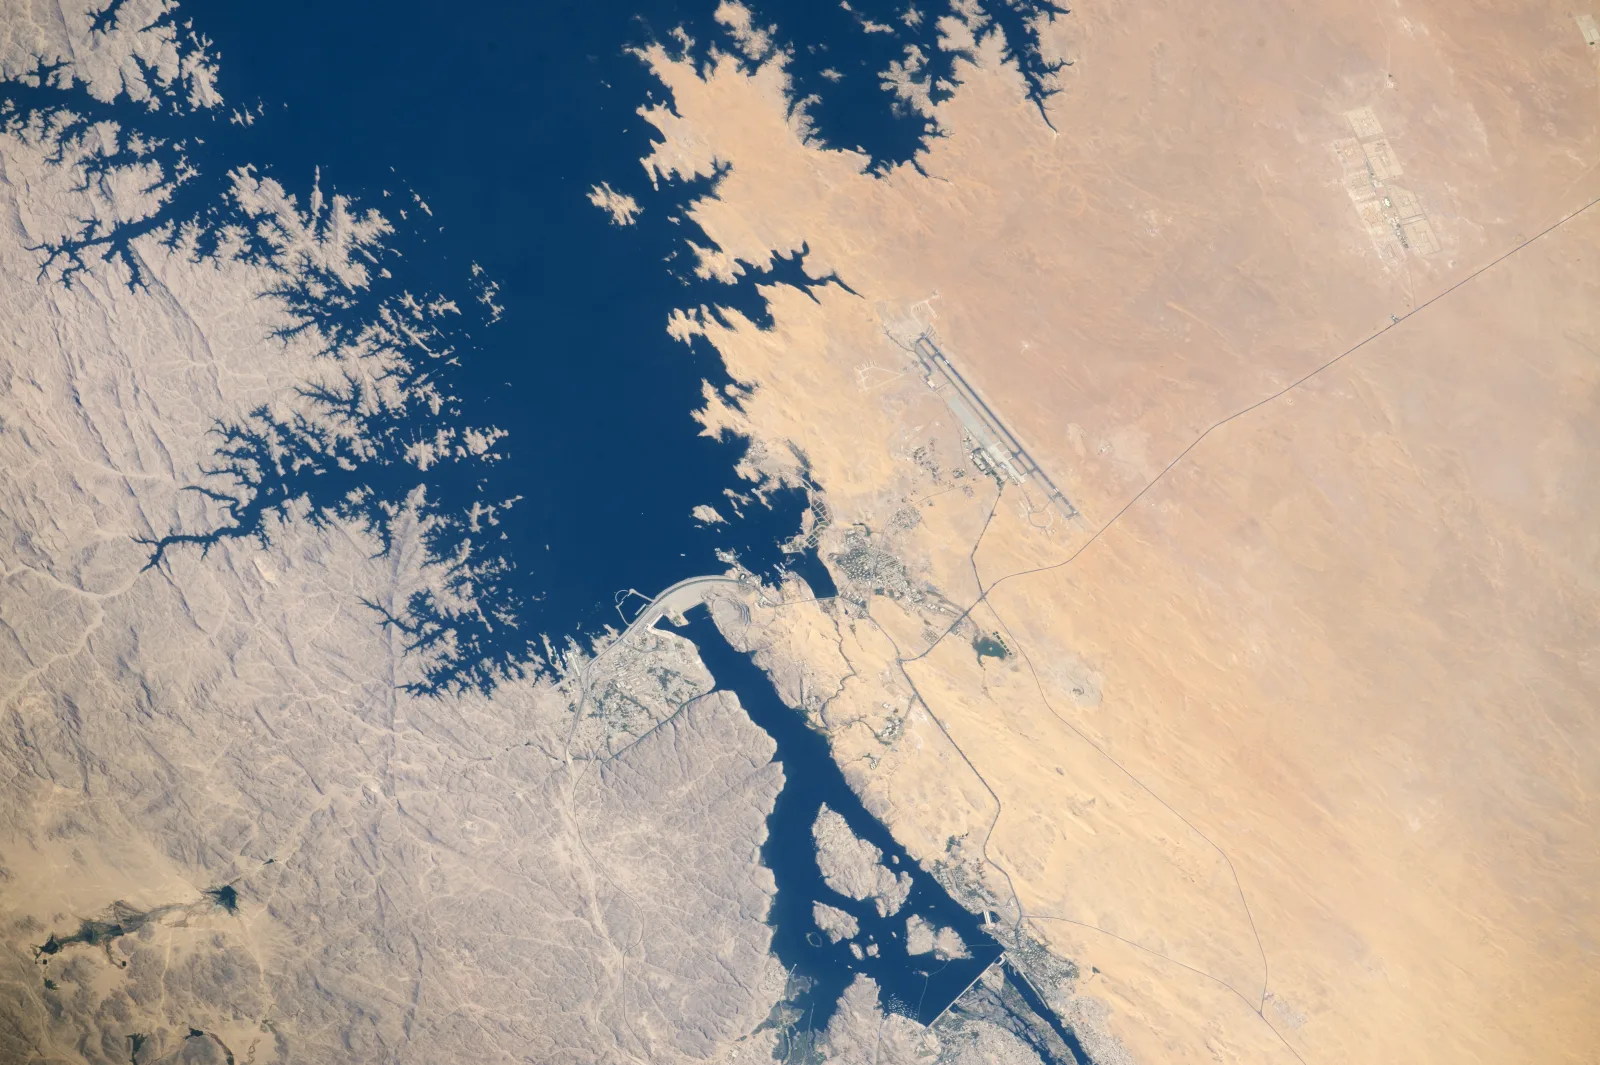
A recurring InSAR monitoring program tracks ground and structural deformation across the Aswan Dam in Egypt on a quarterly basis, measuring movement at the millimeter level well ahead of anything that would be visible on a site inspection.
Geohazard Response · Venezuela
Directing Rescue Teams During Major Landslides
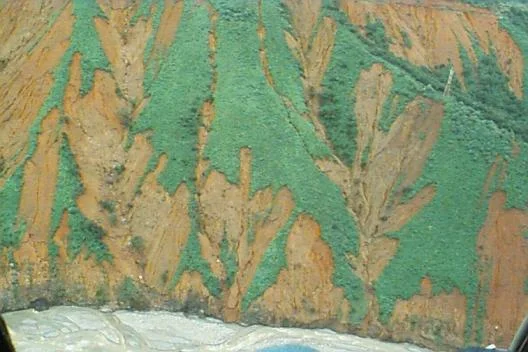
Rapid-tasking satellite imagery delivered timely disaster and damage assessment during major landslides in Venezuela, giving ground rescue teams a mapped debris field and access-route status to work from instead of searching blind.
Pricing & Delivery
Disaster Monitoring Satellite Imagery Pricing
Transparent per-km² pricing for archive and new-tasking imagery, delivered in the GIS format your team already works in. Not sure what you need? Tell us what happened and where and we'll recommend the right imagery.
Standard Archive
Existing imagery, 90+ days old, ready to download within minutes
Super High Resolution (30cm)$20/km²
Very High Resolution (31-50cm)$13/km²
High Resolution (51-80cm)$5/km²
Minimum order area 25km² per scene.
New Satellite Tasking
Fresh capture of your exact disaster area and date range
Super High Resolution (30cm)$30/km²
Very High Resolution (31-50cm)$20/km²
High Resolution (51-80cm)$8/km²
Minimum order area 100km² per scene. Standard Archive, Fresh Collection, Priority Collection, and Emergency Collection tasking tiers are available, with Emergency Collection prioritized above all other orders for crisis response. Stereo imagery is priced at 2x mono pricing, tri-stereo mapping at 3x.
Why Satellite Monitoring
Application Benefits
Faster Emergency Response
Analysis-ready imagery within 24 hours turns a slow ground survey into a same-day situational picture.
Clearer Situational Awareness
All-weather SAR keeps imaging through the cloud cover, smoke, and darkness that disasters usually bring with them.
Stronger Infrastructure Safety
Millimeter-level InSAR deformation tracking turns a surprise structural failure into a scheduled repair.
Defensible Insurance Evidence
Timestamped before-and-after imagery supports claims and audits without a site visit for every property.
Better-Informed Recovery Planning
Repeat captures turn rebuilding and rehabilitation into a measurable, reportable progress record.
From the Blog
Disaster Monitoring Guides From Our Blog
More on radar flood mapping, emergency tasking, and satellite-based disaster response.
Tell us what you're looking for and our team will reply with options and pricing — usually within one business day.
50cm Resolution — SuperView Neo-3
See individual vehicles, crosswalks, and site detail like this, anywhere on Earth.
130+ satellites, archive and new tasking
Reply within one business day
No spam, ever
Enquiry sent
Thanks — we'll get back to you by email shortly.
Frequently Asked Questions
What is disaster monitoring satellite imagery?
Disaster monitoring satellite imagery is satellite-based Earth observation data, optical, SAR, hyperspectral, and geostationary data, used to prepare for, respond to, and recover from floods, wildfires, earthquakes, landslides, and oil spills, without relying on ground surveys alone.
How is satellite imagery used in disaster management?
Satellite imagery is used in disaster management for flood and waterline mapping, wildfire ignition and smoke-plume tracking, earthquake and infrastructure deformation monitoring, landslide and geohazard response, marine oil spill detection, and feeding a unified AI emergency command platform. Different sensor types answer different questions, and most disaster programs combine more than one.
How fast can satellite imagery be delivered after a disaster?
Emergency tasking typically delivers analysis-ready imagery within 24 hours of a request, as in the Derna, Libya flood response, where clear waterline mapping and evacuation-route modeling were delivered in that window.
Can satellites see through clouds, smoke, or darkness during a disaster?
Yes. Synthetic Aperture Radar (SAR), including GF-3 C-band and LT-1 L-band, images through heavy storm cloud, tropical fog, smoke, and complete darkness, conditions that frequently accompany the disaster itself and would ground an optical-only tasking request.
How does InSAR detect ground deformation before a dam or bridge fails?
Interferometric SAR (InSAR) compares the radar phase between repeat satellite passes to measure ground and structural movement at 1-2mm accuracy. Applied to a dam, bridge, or power plant, it surfaces a deformation trend well before it would be visible to a site inspection, as in the quarterly program monitoring the Aswan Dam in Egypt.
How does a geostationary satellite track a wildfire in real time?
GF-4 sits in geostationary orbit at 36,000km and stares continuously at the same region, refreshing roughly every 20 seconds. Repeated captures turn into a time-lapse of ignition points, smoke-plume direction, and fire-front movement, far faster than a satellite that only passes overhead once a day.
What type of satellite imagery is best for disaster monitoring?
Very high-resolution optical imagery is best for pre-disaster baselines and building-level damage assessment, SAR is best for all-weather flood mapping and InSAR deformation, geostationary optical and thermal imagery is best for active wildfire tracking, hyperspectral imagery is best for chemical spill and gas-leak detection, and DEM/DSM elevation data is best for flood inundation modeling and landslide volume calculation. Most disaster programs combine more than one.
Can satellite imagery detect a marine oil spill?
Yes. GF-3 and LT-1 SAR automatically identify ocean-surface oil slicks day or night, and radar-detected slick boundaries are fused with ocean current models to predict how a spill will move. A past emergency tasking operation processed more than 90 SAR scenes in four days to support cleanup coordination for a single spill.
How accurate are satellite-derived landslide and flood volume measurements?
Stereo-derived digital elevation models compare pre- and post-event terrain to calculate how much material moved in a landslide, or how deep floodwater reached across a mapped area, delivered at 2-10m grid spacing with ±3m vertical RMSE precision.
What satellite constellations are used for disaster monitoring?
We combine sub-meter optical imagery (SuperView Neo-1 at 0.25-0.3m, SuperView-1, SuperView-2, GF-7 stereo, GF-6 wide-swath), geostationary GF-4 for continuous wildfire monitoring, GF-3 and LT-1 SAR for all-weather response and InSAR, and hyperspectral sensors including GF-5, GF-5B, and ZY-1 02D/02E for chemical and vegetation-stress detection, across a fleet of over 130 satellites.
How is disaster monitoring satellite imagery delivered and priced?
Imagery is delivered through a cloud platform in GeoTIFF, SHP, DWG, or IMG format. Standard archive imagery runs from $5/km² at 51-80cm resolution up to $20/km² at 30cm, while new emergency tasking runs from $8/km² up to $30/km², with Standard, Fresh, Priority, and Emergency Collection tasking tiers available depending on how urgent the request is.
What outputs are included with a disaster monitoring engagement?
Each engagement can include elevation models (DEM/DSM/DTM) for flood and landslide modeling, orthorectified Digital Orthophoto Maps, AI computer vision layers for automated change detection and damage segmentation, and GIS-ready file formats delivered by cloud download or physical HDD.
Ready to Monitor a Disaster From Orbit?
Search our live archive or request emergency tasking over your affected area, optical, SAR, hyperspectral, or DEM.