Satellite Imagery for Forestry & Forest Monitoring
Satellite imagery for forestry supports every stage of forest management, from deforestation and illegal-logging detection to fire risk, pest and disease stress, carbon sequestration, and wildlife habitat conservation. Red Edge, hyperspectral, SAR, and sub-meter optical sensors help forestry departments, conservation NGOs, and timber companies see change across a forest long before it shows up on the ground.
XRTech Group delivers forestry satellite imagery and the analytics built on top of it on a single platform, one source of Red Edge, hyperspectral, sub-meter optical, and all-weather SAR data spanning deforestation monitoring, fire management, forest health, carbon tracking, and biodiversity conservation. Search or task imagery over your concession, reserve, or plantation, then turn it into canopy-change layers, species maps, carbon reports, and fire-response evidence.
What is forestry satellite imagery?
Forestry satellite imagery is satellite-derived Earth observation data, high-resolution optical, Red Edge, hyperspectral, and SAR data, used to monitor deforestation and illegal logging, manage forest fire risk, detect pest and disease stress, track carbon sequestration and reforestation, and protect wildlife habitat. A fleet combining sub-meter optical detail, 330-channel hyperspectral sensing, and cloud-penetrating radar lets forestry teams compare a concession or reserve against itself over time, instead of relying on periodic ground patrols alone.
How is satellite imagery used in forestry?
Satellite imagery is used in forestry to detect deforestation and illegal logging, track forest fire ignitions and spread, identify pest and disease stress weeks before visible damage, classify tree species, measure carbon stock and reforestation progress, and monitor wildlife habitat and nature reserves. A single hyperspectral capture can fingerprint tree species across a reserve, and comparing captures over time turns that snapshot into a trend regulators and funders can act on.
330Hyperspectral channels (GF-5B) for species & stress fingerprinting
690-770nmRed Edge band range used for early canopy-stress detection
WeeksTypical lead time before visible foliage browning occurs
1:10,000GF-7 stereo mapping scale for canopy elevation models
Monitoring Cycle
How Satellite Imagery Supports Forest Monitoring
Satellite imagery supports forest monitoring from an initial baseline through continuous monitoring to verified reporting, one dataset instead of a different record for every stage.
Baseline — An initial high-resolution and hyperspectral capture establishes canopy cover extent, species composition, and a structural baseline for the forest or concession.
Monitor — Scheduled optical and all-weather SAR captures flag canopy loss, new access roads, fire ignitions, and pest or disease stress as they happen, not months later.
Verify & Report — Change layers and index time series turn into timestamped evidence for compliance reporting, carbon credit verification, and reforestation audits.
Process
How It Works
From a defined forest area to analysis-ready products in your GIS, one pipeline for every capture.
Define Your Forest Area & Question — Upload a boundary for your concession, reserve, or plantation and tell us the question, illegal logging detection, fire risk, pest stress, or carbon stock change. We match sensor, cadence, and processing to it.
Task or Pull From Archive — We search archive imagery across 130+ satellite constellations and task the right sensor for a fresh capture where the archive falls short, optical for detail, SAR where cloud cover rules it out.
Process to Analysis-Ready Products — Captures are orthorectified, pansharpened, and run through AI change detection to produce canopy-loss layers, fire perimeters, species maps, and vegetation-index time series.
Deliver to Your GIS — Products land in ArcGIS, QGIS, S3, or SFTP, in GeoTIFF, SHP, or IMG format, the way your forestry or conservation team already works.
Fleet
Our Satellite Fleet
Red Edge, hyperspectral, sub-meter optical, all-weather radar, and autonomous drone platforms, each matched to a specific forestry task.
Red Edge Optical · 2m – 8m
GF-6 & SuperView-2 (GFDM)
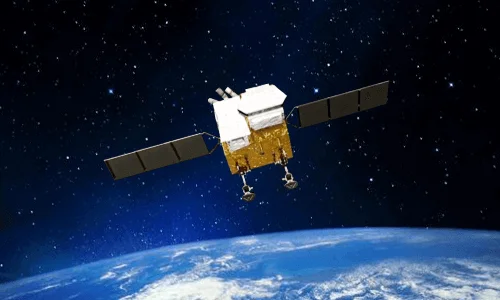
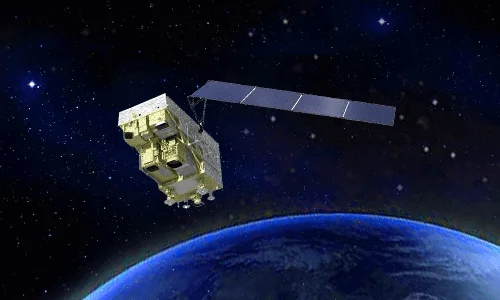
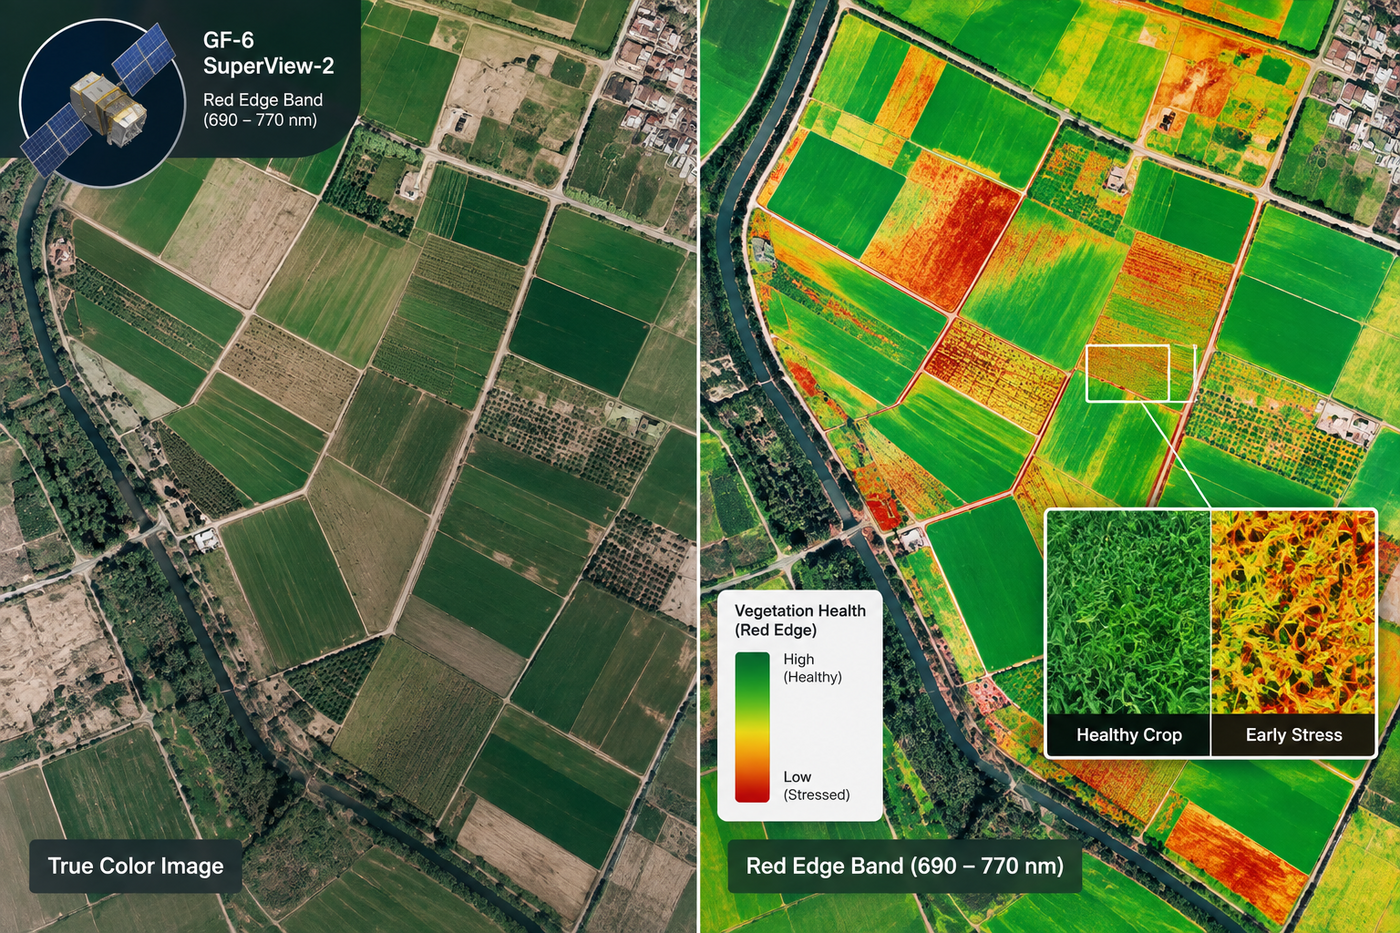
GF-6 (2m PAN / 8m MS) and SuperView-2 (0.42m PAN) both carry dedicated Red Edge bands, picking up early disease, pest infestation, and chlorophyll stress before it is visible to the eye.
Hyperspectral · 30m / 330 bands
GF-5 / GF-5B & ZY-1 02D
GF-5B (330 channels) and ZY-1 02D (166 channels) measure continuous narrow spectral bands across 400 to 2500nm, enough to classify tree species, map canopy moisture, and run mineral and soil studies.
VHR Optical · 0.3m – 0.5m PAN
SuperView Neo-1 & SuperView-1
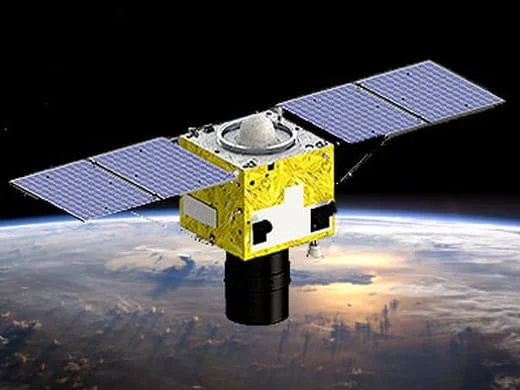
Sub-meter optical detail from SuperView Neo-1 (0.3m) and SuperView-1 (0.5m) supports high-detail tree crown mapping, individual tree counting, and access-road inspection.
All-Weather SAR · 1m – 3m
GF-3 & LT-1
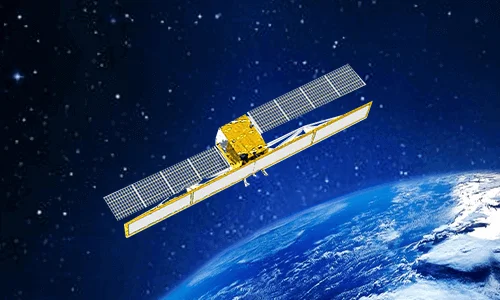
C-band GF-3 (1m) and L-band LT-1 (3m) radar cut through persistent cloud cover, fog, and rain to deliver cloud-free deforestation mapping and all-weather canopy structure tracking over tropical rainforest.
Autonomous Drones
Drone-in-a-Box Platforms
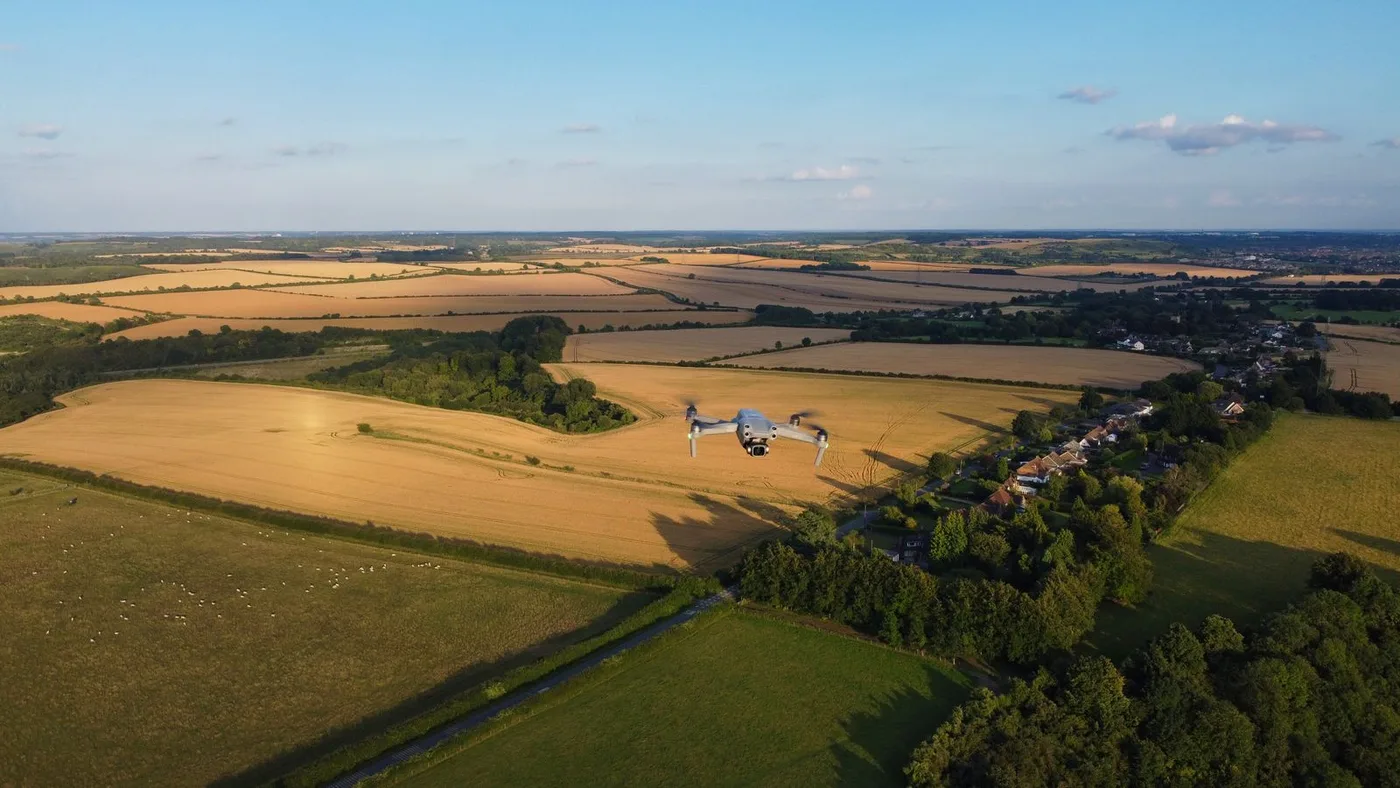
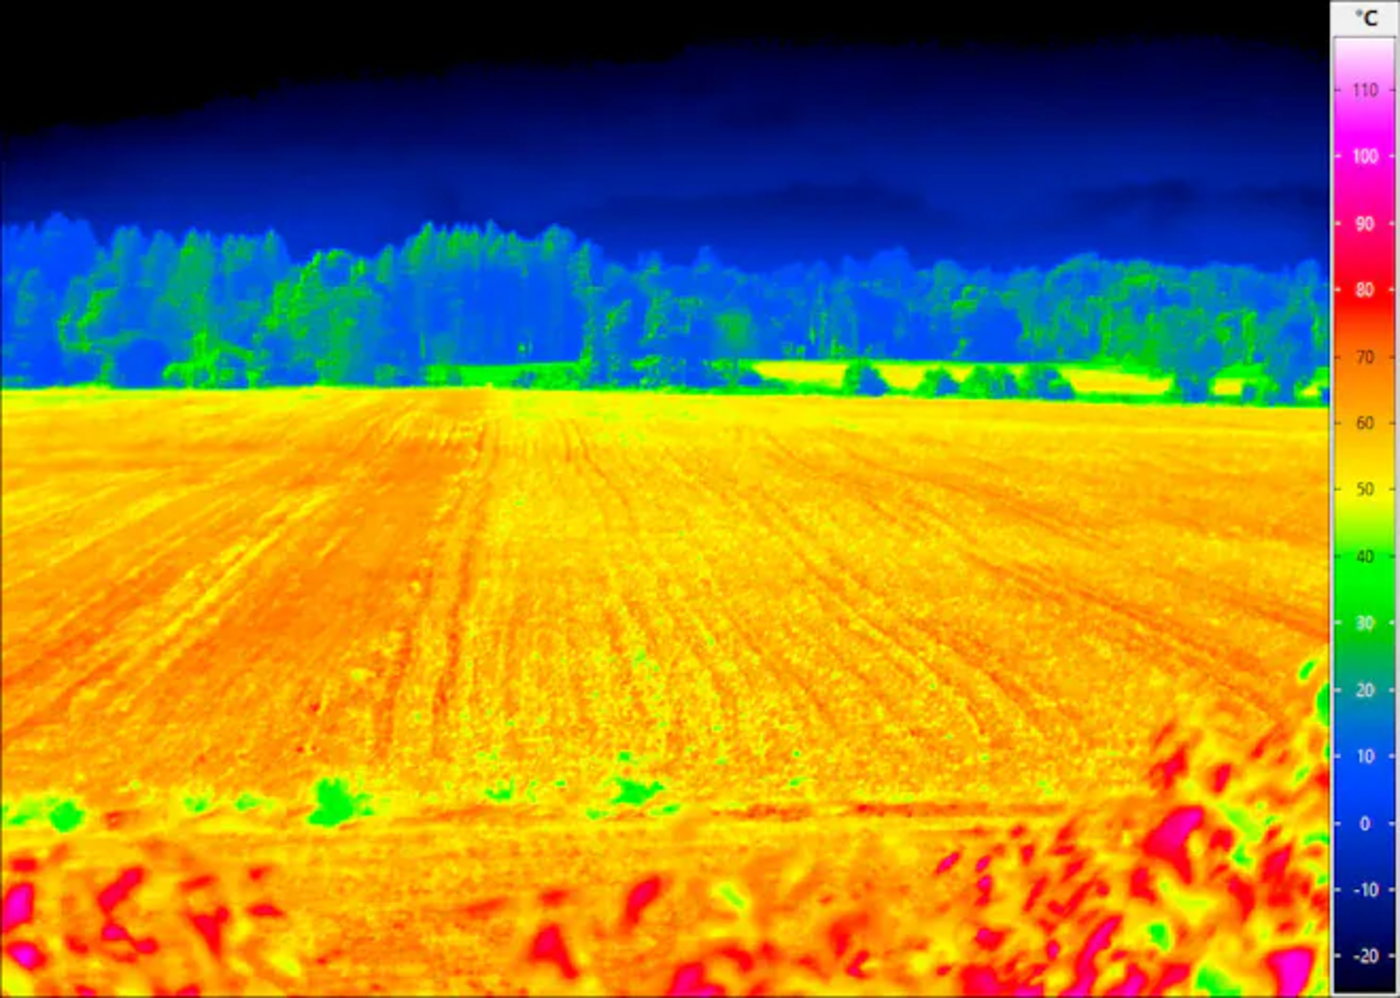
Dock-based platforms such as DJI Dock 2, Autel EVO Nest, and Dragonfish Nest extend satellite coverage with localized thermal patrols for fire detection and wildlife monitoring between scheduled captures.
Examples
Forestry Satellite Images
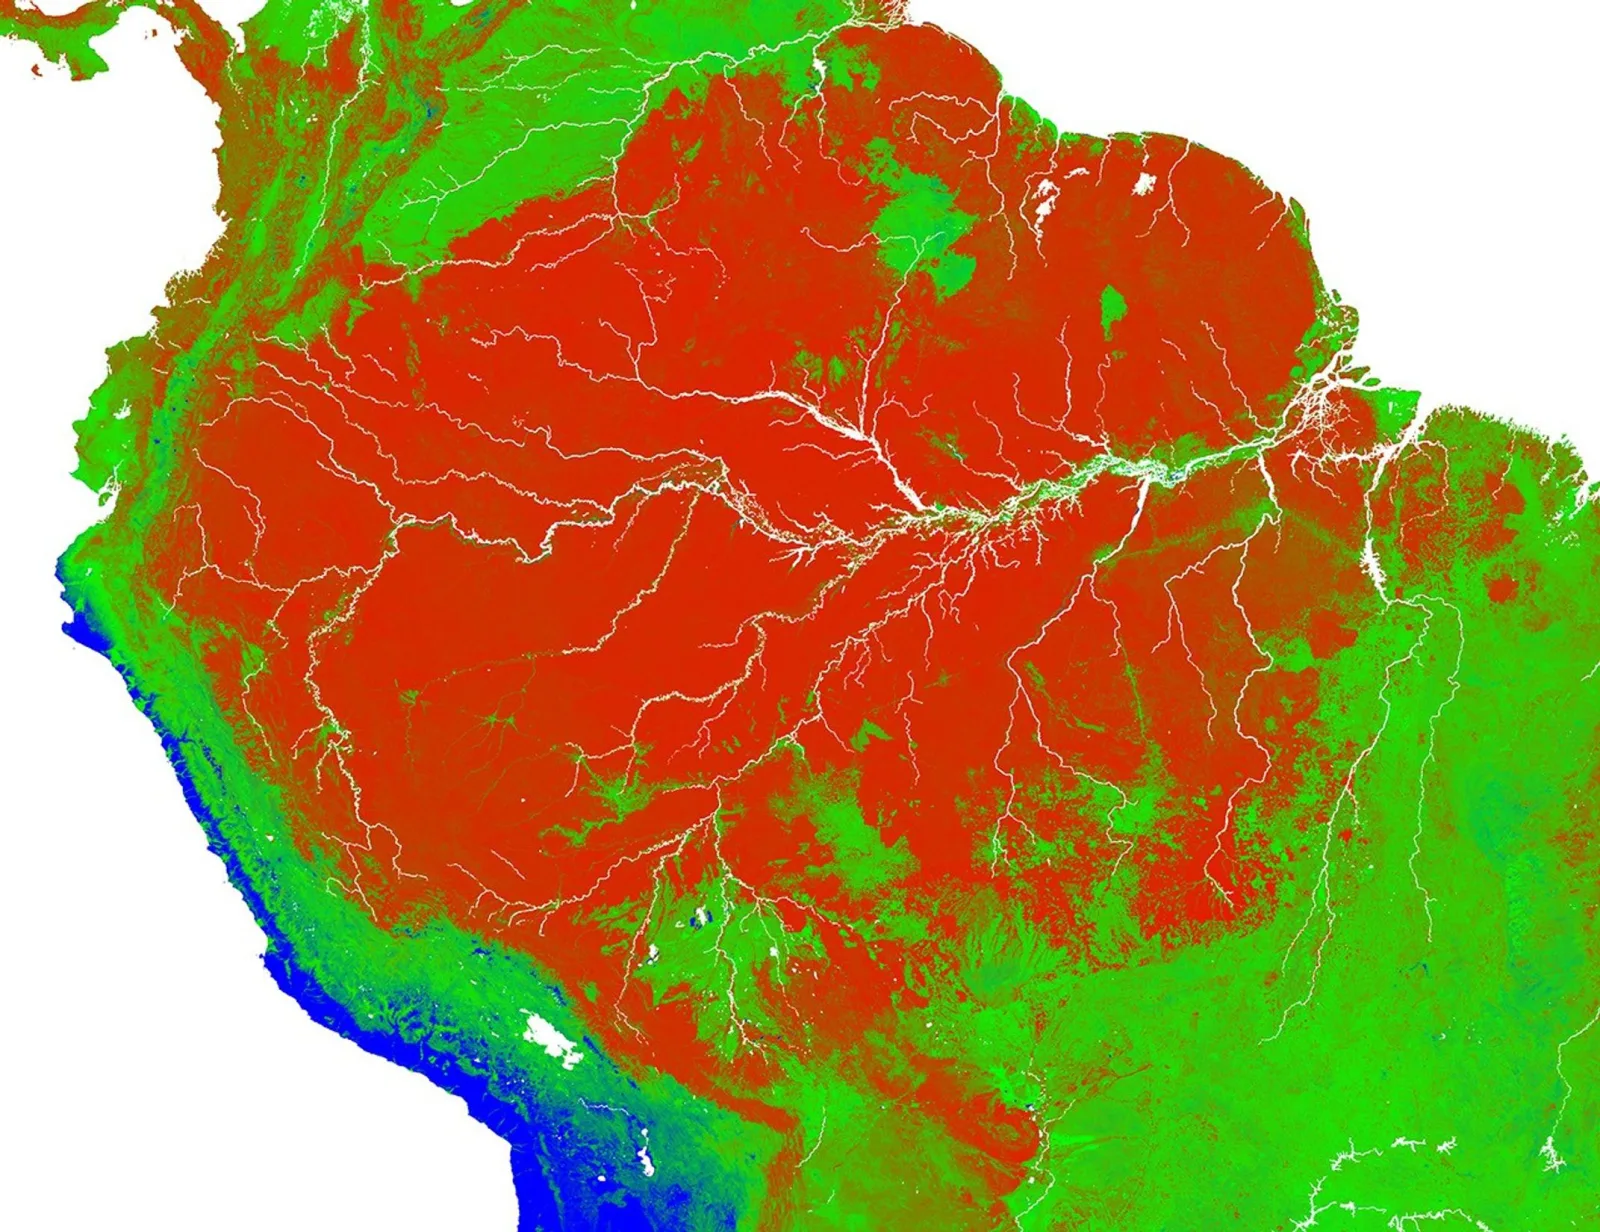
Real capture examples across sensor types, from a land-cover classification over the Amazon basin to a wildfire burn-area monitoring map.
A satellite-derived land cover classification across the Amazon basin, the same type of layer used to track forest extent over time.Hyperspectral imagery alongside standard RGB for the same area, showing the extra compositional detail used for species and stress mapping.A GF-1 monitoring map from a forest fire in Xichang City, Sichuan Province, outlining a 3,446-hectare burned area for response teams.
Who It's For
Who Uses Forestry Satellite Imagery?
The same imagery supports different decisions depending on who is looking at it.
Forestry Departments & Government Agencies
Monitor concession boundaries, verify permitted logging activity, and enforce protected-zone restrictions across a wide jurisdiction.
Conservation NGOs & Carbon Project Developers
Build the timestamped, reproducible evidence a carbon credit registry or conservation funder actually requires.
Timber & Forestry Companies
Track stand health, estimate timber volume, and plan harvest rotations without a ground crew walking every block.
Insurance & ESG Auditors
Validate sustainability claims and reforestation commitments against an independent, dated imagery record.
Research Institutions
Pull multi-year, multi-sensor time series for ecological research without assembling data from a dozen separate sources.
Solutions
Satellite-Based Forestry Solutions
From deforestation monitoring to wildlife habitat conservation, satellite data and AI analytics support every stage of forest management.
01 — SOLUTION
Deforestation, Illegal Logging & Land Cover Monitoring
A cleared patch of forest is easy to miss from the ground, but hard to hide from a satellite that passes over the same area on a schedule.
Real-Time Deforestation Tracking: High-resolution satellite imagery and automated AI change detection monitor forest canopy cover loss, illegal logging, and unauthorized land conversion in near-real-time.
Smart Land Law Enforcement: AI algorithms interpret remote sensing imagery to identify illegal encroachments, unauthorized road building, and land clearing within protected forest zones, supporting rapid evidence collection for regulatory compliance.
All-Weather SAR Change Detection: C-band (GF-3) and L-band (LT-1) SAR penetrate persistent cloud cover, fog, and rain to monitor tropical rainforests where optical sensors are blinded for weeks at a time.
02 — SOLUTION
Space-Sky-Ground Integrated Forest Fire Management
A wildfire changes by the hour, so tracking one well means combining a satellite that never looks away with the ground and air assets that respond to it.
AI Early Warning System: An integrated cloud platform combines satellite, aerial drone, and ground IoT sensor data to detect forest fire ignitions automatically.
Real-Time Fire Tracking: Minute-by-minute updates on active fire fronts, smoke plume dispersion, and fire movement direct firefighting crews safely.
Post-Fire Damage & Burn Area Assessment: Maps post-fire scar extents, calculates timber loss, and evaluates soil erosion risk to plan reforestation and ecological recovery.
03 — SOLUTION
Forest Health, Pest & Disease Detection & Species Mapping
By the time a stand of trees visibly browns, the stress behind it has usually been building for weeks, early detection is what turns that into a manageable problem.
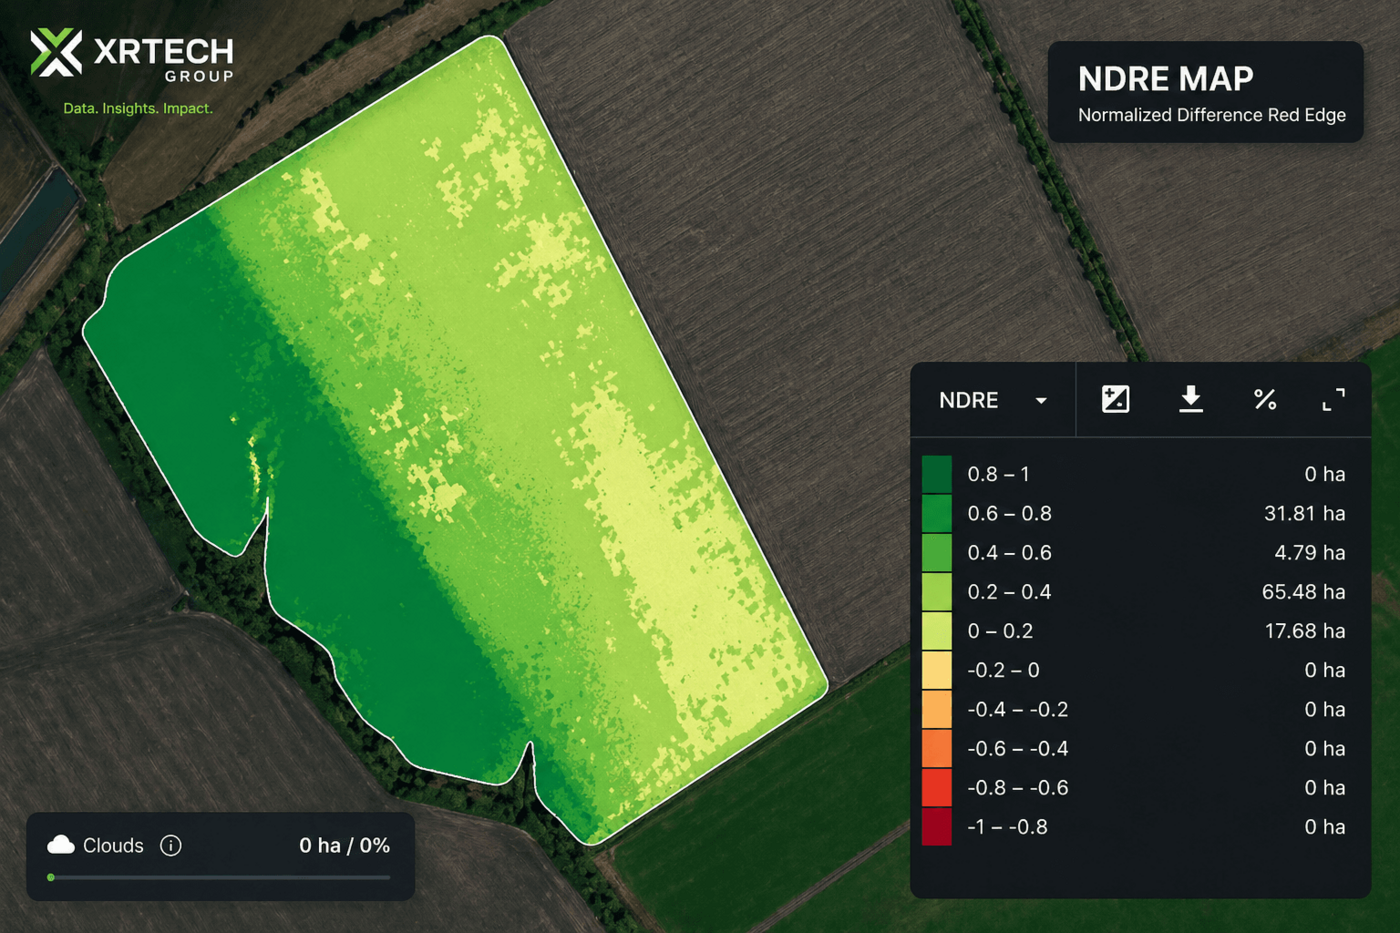
Early Pest & Disease Identification: Satellites equipped with specialized Red Edge bands (690 to 770nm), such as GF-6 and SuperView-2, detect subtle drops in chlorophyll content and leaf cell structure weeks before visible foliage damage or browning occurs.
Hyperspectral Chemical Fingerprinting: Sensors like GF-5B (330 spectral channels) and ZY-1 02D (166 channels) measure continuous narrow spectral bands across 400 to 2500nm to classify tree species, map canopy stress, and identify invasive plant species.
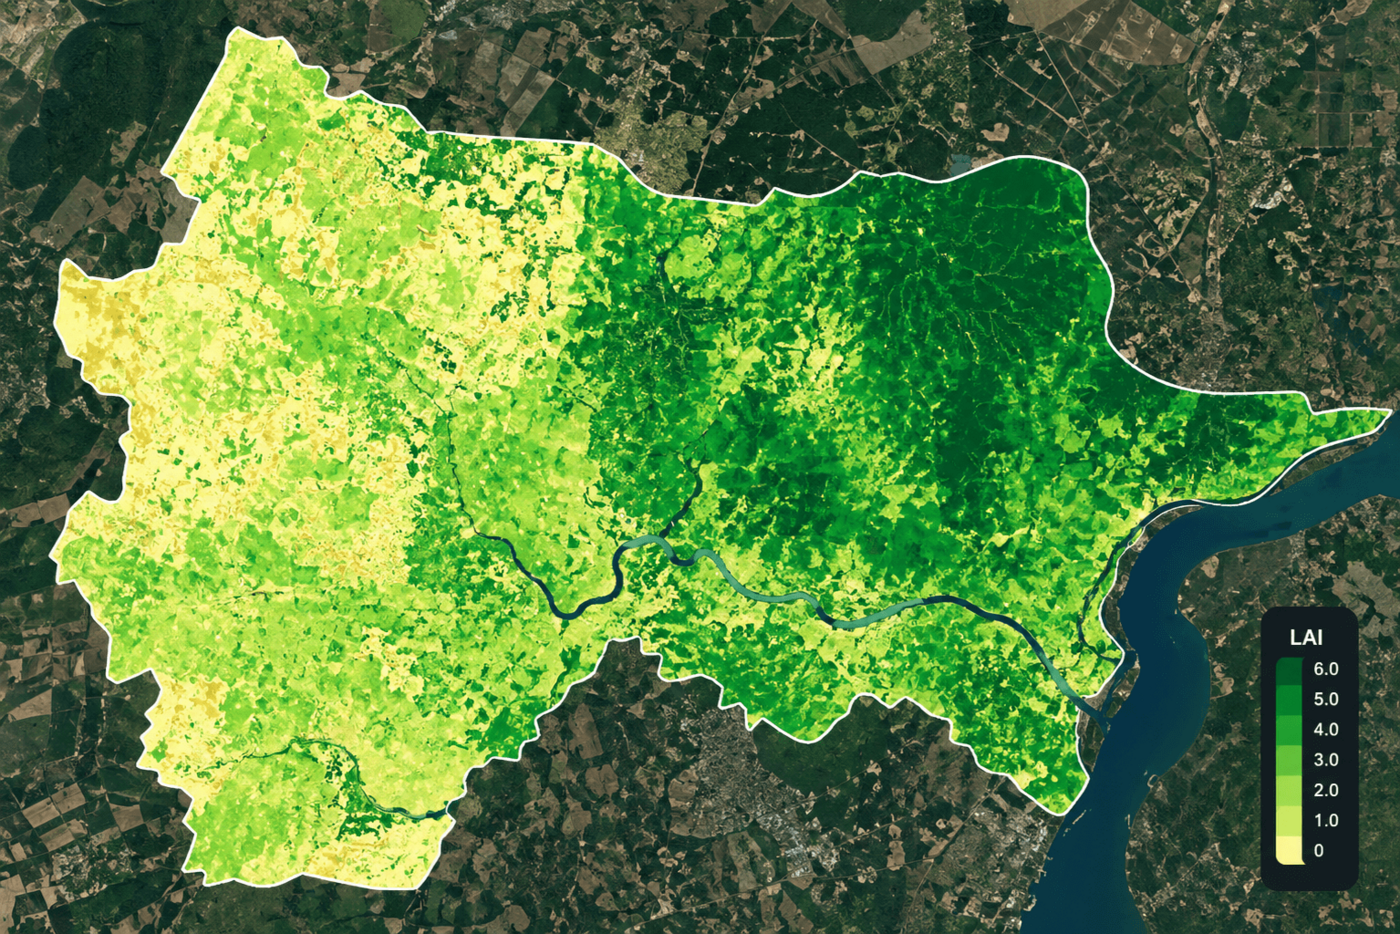
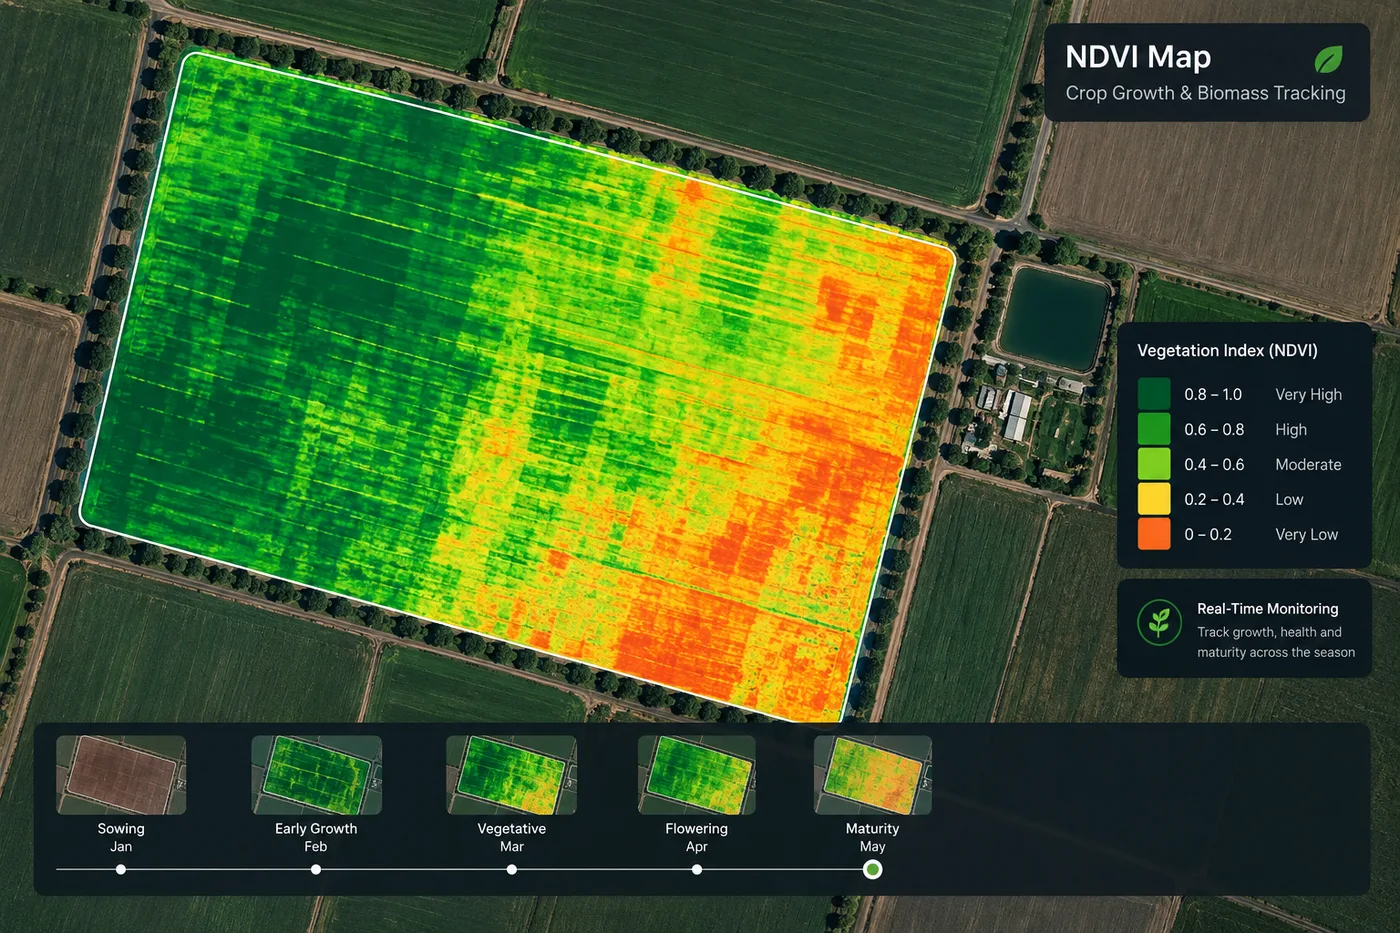
Biomass & Canopy Inventory: Calculates Leaf Area Index (LAI), Normalized Difference Red Edge (NDRE), and canopy density to estimate timber volume, growth rates, and forest vigor.
A carbon credit or a reforestation grant is only as good as the evidence behind it, and that evidence has to hold up over years, not just at sign-off.
Carbon Inventory & Sequestration Tracking: Measures greenhouse gas absorption and estimates forest carbon storage capacity to support global climate change mitigation, carbon offset verification, and ESG reporting.
Reforestation & Afforestation Audits: Monitors the growth, survival rate, and density of newly planted trees in restoration zones over multi-year timelines.
05 — SOLUTION
Biodiversity & Wildlife Habitat Conservation
Protecting a reserve starts with knowing what is actually happening inside its boundary, which is difficult to track continuously from the ground alone.
Habitat Mapping & Corridor Analysis: Maps critical forest habitats, fragmentation patterns, and ecological corridors to preserve native flora and fauna.
Nature Reserve Supervision: Tracks human activities, unauthorized settlements, and livestock grazing within protected reserves and national parks.
Wildlife Tracking via Thermal Drones: Low-altitude drones equipped with thermal sensors observe animal populations and migration patterns at night without causing physical disturbance.
Imagery Types
What Type of Satellite Imagery Is Best for Forestry?
Different sensor types answer different forestry questions, and most monitoring programs end up combining more than one.
Imagery Type
What It Reveals
Best For
Red Edge Optical
Subtle chlorophyll and leaf-structure changes, weeks before visible browning
Early pest and disease detection, canopy-stress screening
Hyperspectral
Continuous narrow spectral bands that fingerprint vegetation composition
Tree species classification, canopy moisture, invasive species mapping
Sub-Meter VHR Optical
Sharp, true-color detail down to individual tree crowns
Tree crown mapping, individual tree counting, access-road inspection
All-Weather SAR
Canopy structure and ground movement, regardless of cloud cover
Cloud-free deforestation mapping over tropical rainforest
Autonomous Drone (Thermal)
Localized heat signatures from the air at low altitude
Fire-front detection, nighttime wildlife population counts
Deliverables
The Outputs We Deliver
Every engagement includes canopy-change layers, carbon and biomass reports, and species classification maps, not just raw imagery.
Canopy Cover & Change Layers
Automated change detection flagging canopy loss, new clearings, and disturbance footprint between scheduled captures.
Carbon Stock & Biomass Reports
LAI, NDRE, and canopy-density derived estimates of timber volume and carbon storage, ready for offset verification.
Species & Stress Classification Maps
Hyperspectral-derived maps classifying tree species, canopy stress, and invasive plant presence.
GIS-Ready File Formats
Delivered in GeoTIFF, SHP, or IMG format in WGS84 or UTM projections, by cloud download or physical HDD.
Pricing & Delivery
Forestry Satellite Imagery Pricing
Transparent per-km² pricing for archive and new-tasking imagery, delivered in the GIS format your team already works in. Not sure what you need? Tell us about your forest area and we'll recommend the right imagery.
Standard Archive
Existing imagery, 90+ days old, ready to download within minutes
Super High Resolution (30cm)$20/km²
Very High Resolution (31-50cm)$13/km²
High Resolution (51-80cm)$5/km²
Minimum order area 25km² per scene.
New Satellite Tasking
Fresh capture of your exact forest area and date range
Super High Resolution (30cm)$30/km²
Very High Resolution (31-50cm)$20/km²
High Resolution (51-80cm)$8/km²
Minimum order area 100km² per scene. Priority tasking is available ahead of a compliance deadline or audit window.
Why Satellite Monitoring
Application Benefits
Earlier Threat Detection
Red Edge and hyperspectral screening catch pest, disease, and logging activity weeks before a ground survey would.
Defensible Compliance Evidence
Timestamped, reproducible imagery supports regulatory and ESG reporting without a scramble.
Verified Carbon Credits
Multi-year biomass and canopy data back an offset claim with independent evidence, not a one-time estimate.
Lower Field Survey Costs
Wide-area satellite and drone coverage replaces a ground crew walking every block of a concession.
Stronger Conservation Outcomes
Continuous reserve supervision catches encroachment and habitat loss while it is still small enough to act on.
From the Blog
Forestry Guides From Our Blog
More on canopy monitoring, hyperspectral species mapping, and satellite-based conservation.
Tell us what you're looking for and our team will reply with options and pricing — usually within one business day.
50cm Resolution — SuperView Neo-3
See individual vehicles, crosswalks, and site detail like this, anywhere on Earth.
130+ satellites, archive and new tasking
Reply within one business day
No spam, ever
Enquiry sent
Thanks — we'll get back to you by email shortly.
Frequently Asked Questions
What is forestry satellite imagery?
Forestry satellite imagery is satellite-based Earth observation data, high-resolution optical, Red Edge, hyperspectral, and SAR data, used to monitor deforestation and illegal logging, manage forest fire risk, detect pest and disease stress, track carbon sequestration and reforestation, and protect wildlife habitat, without relying on ground surveys alone.
How is satellite imagery used in forestry?
Satellite imagery is used in forestry for deforestation and illegal-logging detection, forest fire tracking and burn-area assessment, early pest and disease identification, tree species mapping, carbon stock and reforestation monitoring, and biodiversity and habitat conservation. Different sensor types answer different questions, and most forestry programs combine more than one.
Can satellites detect illegal logging before it spreads?
Yes. High-resolution imagery combined with automated AI change detection monitors canopy cover loss, unauthorized road building, and land clearing in near-real-time, and C-band and L-band SAR keep watching through the persistent cloud cover that blinds optical sensors over tropical rainforest for weeks at a time.
How early can satellite imagery detect a pest or disease outbreak?
Sensors with Red Edge bands (690 to 770nm), such as GF-6 and SuperView-2, detect subtle drops in chlorophyll content and leaf cell structure weeks before visible foliage damage or browning occurs, giving a forestry team time to act before an outbreak spreads.
Can hyperspectral imagery identify individual tree species?
Hyperspectral sensors like GF-5B (330 spectral channels) and ZY-1 02D (166 channels) measure continuous narrow spectral bands across 400 to 2500nm, enough to classify tree species, map canopy stress, and identify invasive plant species across a forest or reserve.
How does satellite imagery support forest fire management?
An integrated platform combines satellite, aerial drone, and ground IoT sensor data to detect fire ignitions automatically, then provides minute-by-minute updates on fire fronts and smoke plume dispersion to direct firefighting crews. After a fire, imagery maps the burn-scar extent and supports reforestation planning.
How is satellite imagery used to verify carbon credits?
Multi-year vegetation-index time series, including LAI and NDRE, combined with canopy-cover change detection, measure greenhouse gas absorption and forest carbon storage over time, giving carbon offset programs and ESG reports independent, reproducible evidence instead of a one-time estimate.
What type of satellite imagery is best for forestry?
Red Edge optical imagery is best for early pest and disease detection, hyperspectral imagery is best for tree species classification, sub-meter VHR optical imagery is best for individual tree crown mapping, all-weather SAR is best for cloud-free deforestation mapping over rainforest, and thermal drones are best for nighttime wildlife counts. Most forestry programs combine more than one.
Can satellite imagery help track wildlife and protect habitat?
Satellite imagery maps critical habitats, fragmentation patterns, and ecological corridors, and tracks human activity, unauthorized settlements, and grazing within a protected reserve. Low-altitude thermal drones extend that coverage to nighttime wildlife population and migration counts without disturbing animals.
What satellite constellations are used for forestry monitoring?
We combine Red Edge optical sensors (GF-6, SuperView-2), hyperspectral sensors (GF-5, GF-5B, ZY-1 02D), sub-meter VHR optical imagery (SuperView Neo-1, SuperView-1), and all-weather SAR (GF-3, LT-1), extended with drone-in-a-box platforms like DJI Dock 2 and Autel EVO Nest for localized thermal patrols.
How is forestry satellite imagery delivered and priced?
Imagery is delivered through a cloud platform in GeoTIFF, SHP, or IMG format. Standard archive imagery starts at $5/km² at 51-80cm resolution up to $20/km² at 30cm, while new tasking runs from $8/km² up to $30/km², with priority tasking available ahead of a compliance deadline or audit window.
What outputs are included with a forestry monitoring engagement?
Each engagement can include canopy cover and change layers, carbon stock and biomass reports built from LAI and NDRE, species and stress classification maps from hyperspectral data, and GIS-ready file formats delivered by cloud download or physical HDD.
Ready to Monitor Your Forest From Orbit?
Search our live archive or request new tasking over your concession or reserve, optical, Red Edge, hyperspectral, or SAR.